Intensive Care Unit, Hospital Universitario Arnau de Vilanova, IRBLLEIDA, Lleida (25198), Spain.
BMC Med Res Methodol. 2009 Dec 9;9:83. doi: 10.1186/1471-2288-9-83.
Development of three classification trees (CT) based on the CART (Classification and Regression Trees), CHAID (Chi-Square Automatic Interaction Detection) and C4.5 methodologies for the calculation of probability of hospital mortality; the comparison of the results with the APACHE II, SAPS II and MPM II-24 scores, and with a model based on multiple logistic regression (LR).
Retrospective study of 2864 patients. Random partition (70:30) into a Development Set (DS) n = 1808 and Validation Set (VS) n = 808. Their properties of discrimination are compared with the ROC curve (AUC CI 95%), Percent of correct classification (PCC CI 95%); and the calibration with the Calibration Curve and the Standardized Mortality Ratio (SMR CI 95%).
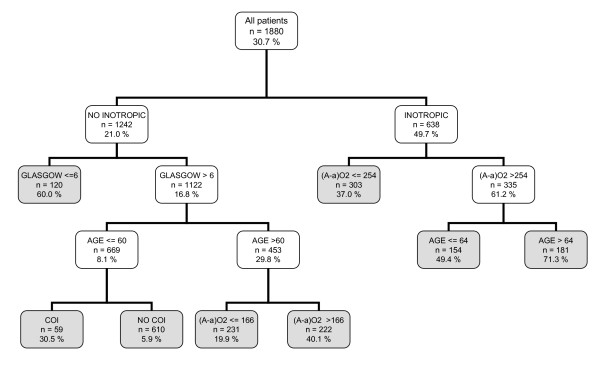
CTs are produced with a different selection of variables and decision rules: CART (5 variables and 8 decision rules), CHAID (7 variables and 15 rules) and C4.5 (6 variables and 10 rules). The common variables were: inotropic therapy, Glasgow, age, (A-a)O2 gradient and antecedent of chronic illness. In VS: all the models achieved acceptable discrimination with AUC above 0.7. CT: CART (0.75(0.71-0.81)), CHAID (0.76(0.72-0.79)) and C4.5 (0.76(0.73-0.80)). PCC: CART (72(69-75)), CHAID (72(69-75)) and C4.5 (76(73-79)). Calibration (SMR) better in the CT: CART (1.04(0.95-1.31)), CHAID (1.06(0.97-1.15) and C4.5 (1.08(0.98-1.16)).
With different methodologies of CTs, trees are generated with different selection of variables and decision rules. The CTs are easy to interpret, and they stratify the risk of hospital mortality. The CTs should be taken into account for the classification of the prognosis of critically ill patients.
基于 CART(分类和回归树)、CHAID(卡方自动交互检测)和 C4.5 方法开发了三个分类树(CT),用于计算医院死亡率的概率; 将结果与 APACHE II、SAPS II 和 MPM II-24 评分进行比较,并与基于多逻辑回归(LR)的模型进行比较。
回顾性研究了 2864 名患者。随机分为开发集(DS)n = 1808 和验证集(VS)n = 808。通过 ROC 曲线(AUC CI 95%)、正确分类百分比(PCC CI 95%)和校准曲线和标准化死亡率比(SMR CI 95%)比较其判别性能。
生成了具有不同变量选择和决策规则的 CT:CART(5 个变量和 8 个决策规则)、CHAID(7 个变量和 15 个规则)和 C4.5(6 个变量和 10 个规则)。共同变量为:正性肌力治疗、格拉斯哥、年龄、(A-a)O2 梯度和慢性疾病病史。在 VS 中:所有模型的 AUC 均大于 0.7,具有可接受的判别能力。CT:CART(0.75(0.71-0.81))、CHAID(0.76(0.72-0.79))和 C4.5(0.76(0.73-0.80))。PCC:CART(72(69-75))、CHAID(72(69-75))和 C4.5(76(73-79))。校准(SMR)在 CT 中更好:CART(1.04(0.95-1.31))、CHAID(1.06(0.97-1.15)和 C4.5(1.08(0.98-1.16))。
使用不同的 CT 方法,生成了具有不同变量选择和决策规则的树。CT 易于解释,可以对医院死亡率的风险进行分层。CT 应考虑用于分类危重症患者的预后。