Department of Medical Physics, Memorial Sloan-Kettering Cancer Center, New York, New York 10021, USA.
J Nucl Med. 2010 Jan;51(1):37-45. doi: 10.2967/jnumed.109.067009. Epub 2009 Dec 15.
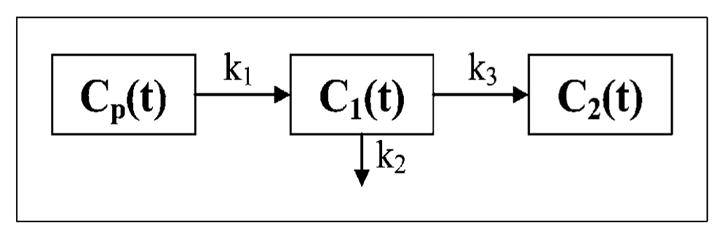
This study used pharmacokinetic analysis of (18)F-labeled fluoromisonidazole ((18)F-FMISO) dynamic PET to assist the identification of regional tumor hypoxia and to investigate the relationship among a potential tumor hypoxia index (K(i)), tumor-to-blood ratio (T/B) in the late-time image, plasma-to-tissue transport rate (k(1)), and local vascular volume fraction (beta) for head and neck cancer patients.
Newly diagnosed patients underwent a dynamic (18)F-FMISO PET scan before chemotherapy or radiotherapy. The data were acquired in 3 consecutive PET/CT dynamic scan segments, registered with each other and analyzed using pharmacokinetics software. The (K(i), k(1), beta) kinetic parameter images were derived for each patient.
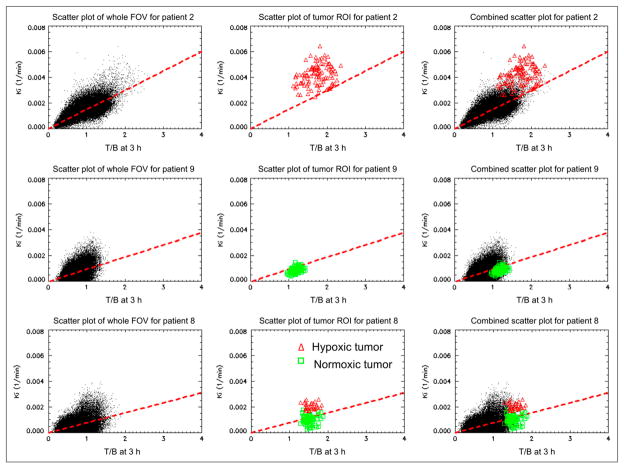
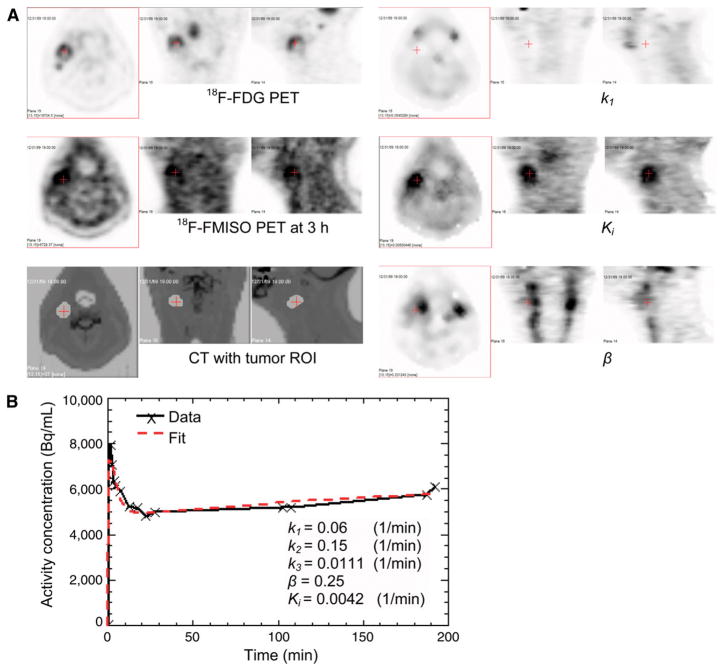
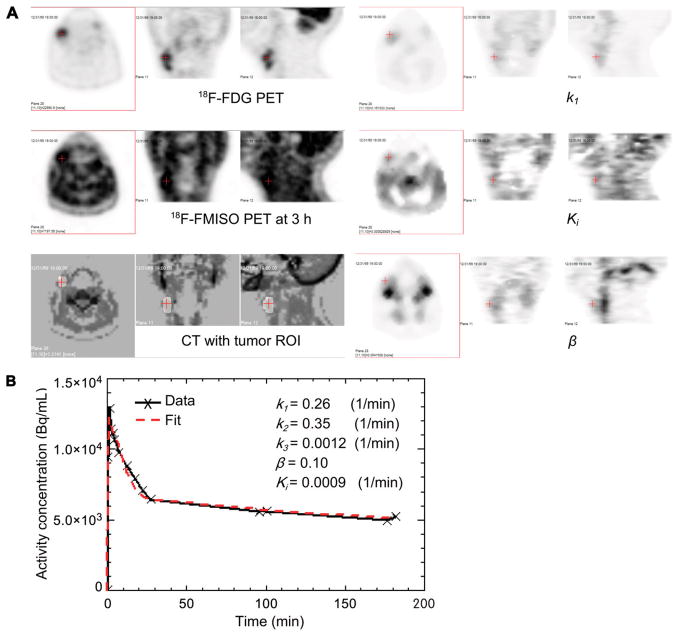
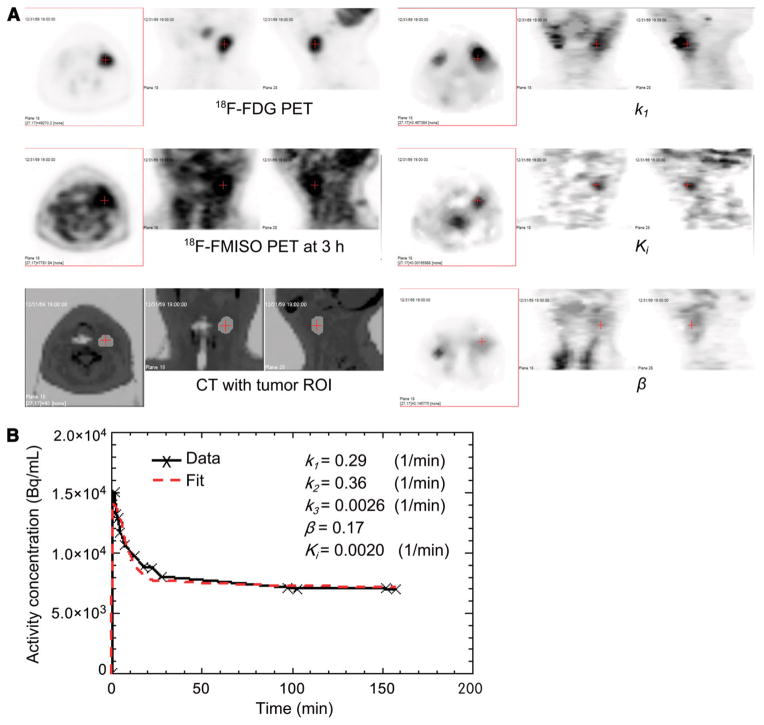
Nine patients' data were analyzed. Representative images of (18)F-FDG PET (of the tumor), CT (of the anatomy), and late-time (18)F-FMISO PET (of the T/B) and parametric images of K(i) (potentially representing tumor hypoxia) are shown. The patient image data could be classified into 3 types: with good concordance between the parametric hypoxia map K(i) and high T/B, with concordant findings between the parametric hypoxia map and low T/B, and with ambiguity between parametric hypoxia map and T/B. Correlation coefficients are computed between each pair of T/B, K(i), k(1), and beta. Data are also presented for other potential hypoxia surrogate measures, for example, k(3) and k(1)/k(2).
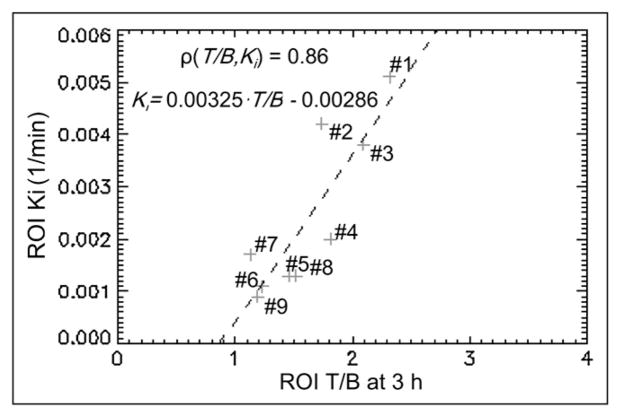
There is a positive correlation of 0.86 between the average T/B and average hypoxia index K(i) of the region of interest. However, because of the statistical photon counting noise in PET and the amplification of noise in kinetic analysis, the direct correlation between the T/B and hypoxia of the individual pixel is not obvious. For a tumor region of interest, there is a slight negative correlation between k(1) and K(i), moderate positive correlation between beta and K(i), but no correlation between beta and k(1).
本研究使用(18)F 标记氟米索硝唑((18)F-FMISO)动态 PET 的药代动力学分析来辅助识别局部肿瘤缺氧,并探讨潜在肿瘤缺氧指数(K(i))、晚期图像肿瘤与血液比(T/B)、血浆与组织转运率(k(1))和局部血管体积分数(β)之间的关系。
新诊断的患者在化疗或放疗前进行动态(18)F-FMISO PET 扫描。数据在 3 个连续的 PET/CT 动态扫描段中采集,相互配准并使用药代动力学软件进行分析。为每位患者生成(K(i),k(1),β)动力学参数图像。
分析了 9 名患者的数据。展示了(18)F-FDG PET(肿瘤)、CT(解剖结构)、晚期(18)F-FMISO PET(T/B)和 K(i)(潜在代表肿瘤缺氧)参数图像的代表性图像。患者图像数据可分为 3 种类型:参数缺氧图 K(i)与高 T/B 之间有很好的一致性,参数缺氧图与低 T/B 之间有一致性,参数缺氧图与 T/B 之间有模糊性。计算了 T/B、K(i)、k(1)和β之间的每对相关系数。还提供了其他潜在缺氧替代指标的数据,例如 k(3)和 k(1)/k(2)。
感兴趣区域的平均 T/B 与平均缺氧指数 K(i)之间存在 0.86 的正相关。然而,由于 PET 中的统计光子计数噪声和动力学分析中噪声的放大,个体像素的 T/B 与缺氧之间的直接相关性不明显。对于肿瘤感兴趣区域,k(1)与 K(i)之间存在轻微负相关,β与 K(i)之间存在中度正相关,但β与 k(1)之间无相关性。