Stroke Center and Department of Neurology, David Geffen School of Medicine, University of California Los Angeles, Los Angeles, Calif 90095, USA.
Stroke. 2010 Feb;41(2):300-6. doi: 10.1161/STROKEAHA.109.566935. Epub 2010 Jan 7.
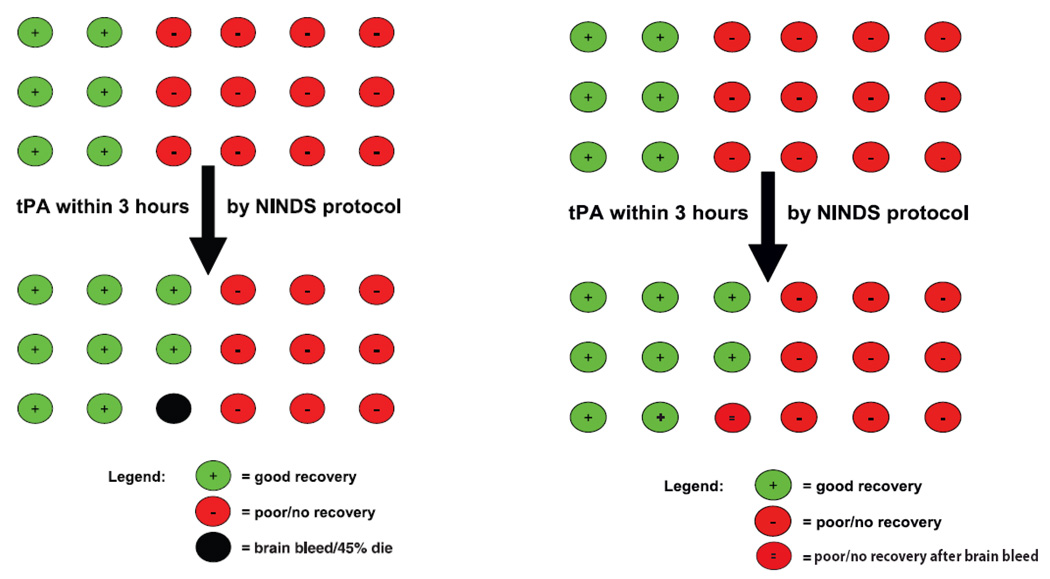
Deciding whether to use intravenous fibrinolytic therapy for acute cerebral ischemia within 3 hours of onset is challenging for patients, family members, and health care providers. Visual displays can permit individuals to rapidly understand response patterns to therapy. This study sought to evaluate, refine, and improve existing visual aids for stroke fibrinolytic decision-making.
Existing visual aids were identified by Medline search and querying of national guideline organizations, pharmaceutical manufacturers, and stroke specialists, and were rated on a formal 8-point quality rating scale (0, lowest; 8, highest). Based on available instruments, new visual displays were developed to improve informed decision-making in routine practice.
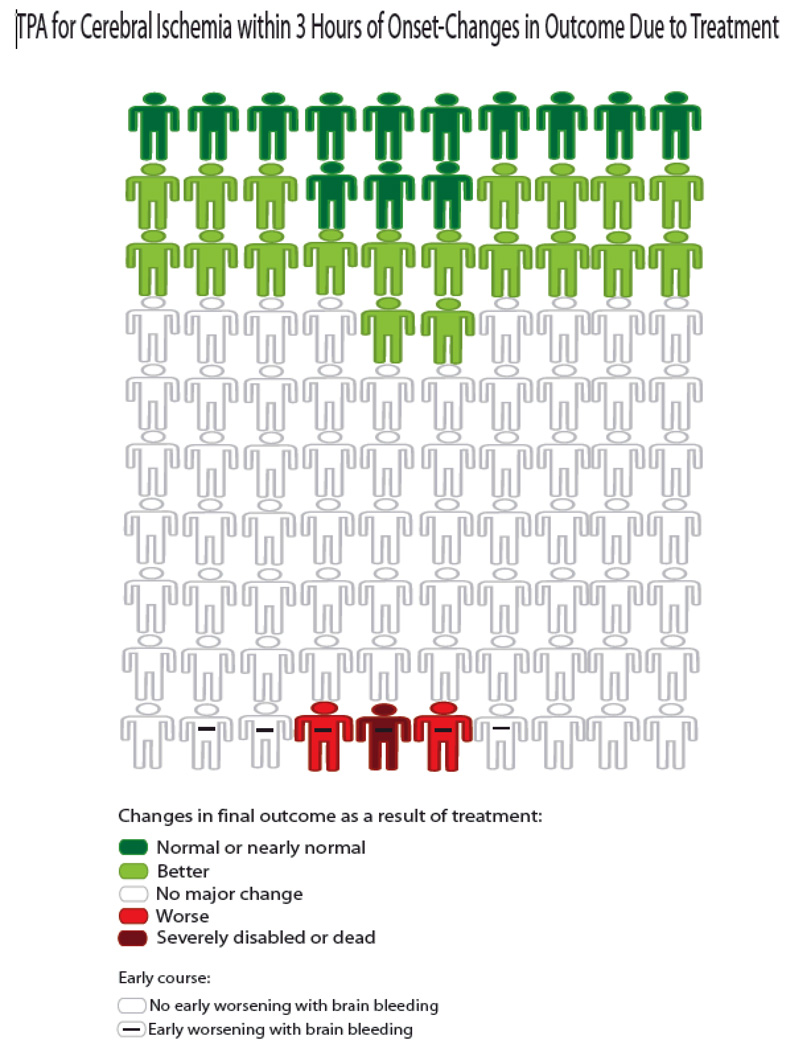
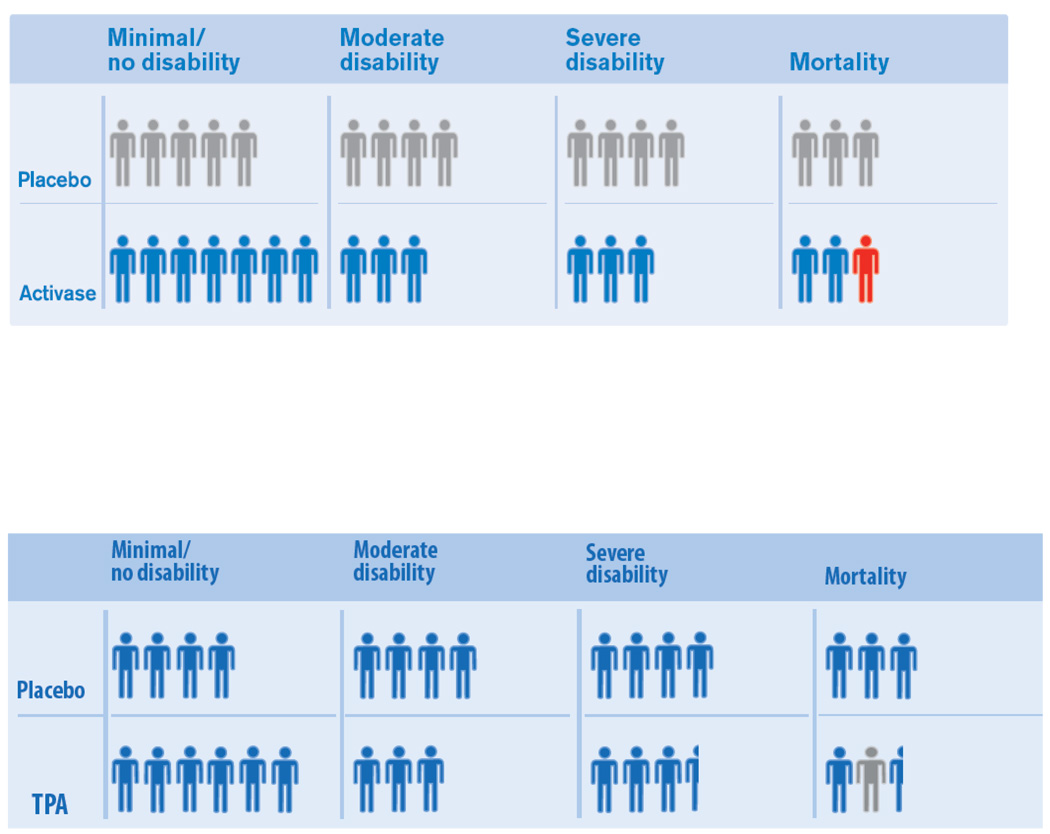
Two existing visual aids were identified, one from an emergency medicine society and one from a pharmaceutical company. Both were comparison visual displays of outcomes with and without treatment; no decision matrix visual aid was found. Both scored 4.0 on the quality scale, showing defects of effect size distortion, privileging less salient outcomes, dissimilar representation by treatment group, and limited stakeholder participation in generation. Revised versions of these graphics were developed with higher quality scores (6.75 and 7.75). In addition, a new decision matrix display with quality score 8.0 was developed that complements the numeric text of a national patient education tool developed jointly by US neurology, emergency medicine, and stroke patient organizations.
Existing visual aids for stroke fibrinolysis decision-making have deficiencies. New visual displays are now available to convey the health benefits and risks of fibrinolytic stroke therapy efficiently and informatively to patients and family members.
对于急性脑缺血发病 3 小时内的患者、家属和医疗保健提供者来说,决定是否使用静脉溶栓治疗极具挑战性。可视化显示可以让个体快速了解治疗的反应模式。本研究旨在评估、改进和完善现有的脑卒中溶栓决策可视化辅助工具。
通过 Medline 搜索以及向国家指南组织、制药商和脑卒中专家查询,确定现有的可视化辅助工具,并对其进行正式的 8 分制质量评分(0 分最低;8 分最高)。基于现有的工具,开发了新的可视化显示,以改善常规实践中的知情决策。
确定了两种现有的可视化辅助工具,一种来自急诊医学学会,另一种来自制药公司。两者都是治疗与不治疗的结果对比可视化显示;没有发现决策矩阵可视化辅助工具。两者的质量评分均为 4.0,存在效果大小失真、优待不太显著的结果、治疗组的表现不同以及利益相关者参与生成有限的缺陷。对这些图形进行了修订,质量评分提高到 6.75 和 7.75。此外,还开发了一种新的决策矩阵显示,质量评分为 8.0,与美国神经病学、急诊医学和脑卒中患者组织联合开发的国家患者教育工具的数字文本相辅相成。
现有的脑卒中溶栓决策可视化辅助工具存在缺陷。现在有新的可视化显示,可以有效地向患者和家属传达溶栓治疗的健康获益和风险信息。