Nik Hisamuddin N A R, Rashidi A, Chew K S, Kamaruddin J, Idzwan Z, Teo A H
Department of Emergency Medicine, Hospital Universiti Sains Malaysia, Kelantan, Malaysia.
Int J Emerg Med. 2009 Feb 24;2(2):83-9. doi: 10.1007/s12245-009-0088-9.
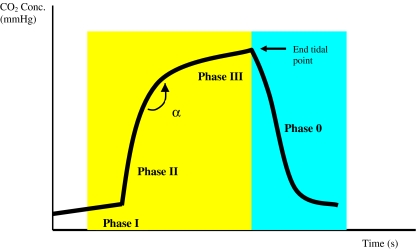
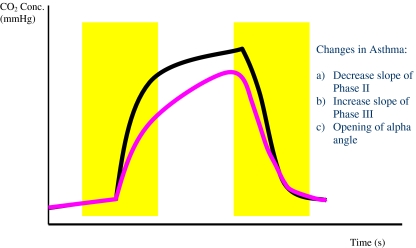
The usual method for initial assessment of an acute asthma attack in the emergency room includes the use of peak flow measurement and clinical parameters. Both methods have their own disadvantages such as poor cooperation/effort from patients (peak flow meter) and lack of objective assessment (clinical parameters). We were looking into other methods for the initial asthma assessment, namely the use of capnography. The normal capnogram has an almost square wave pattern comprising phase 1, slope phase 2, plateau phase 3, phase 4 and angle alpha (between slopes 2 and 3). The changes in asthma include decrease in slope of phase 2, increase in slope 3 and opening of angle alpha.
Our objective was to compare and assess the correlation between the changes in capnographic indices and peak flow measurement in non-intubated acute asthmatic patients attending the emergency room.
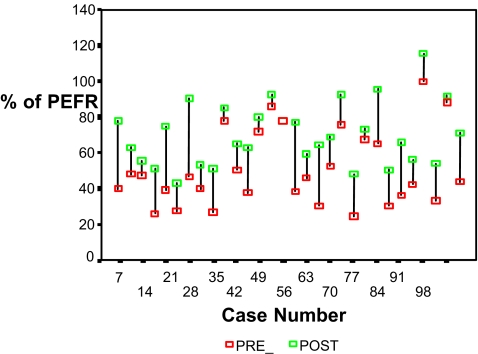
We carried out a prospective study in a university hospital emergency department (ED). One hundred and twenty eight patients with acute asthma were monitored with peak flow measurements and then had a nasal cannula attached for microstream sampling of expired carbon dioxide. The capnographic waveform was recorded onto a PC card for indices analysis. The patients were treated according to departmental protocols. After treatment, when they were adjudged well for discharge, a second set of results was obtained for peak flow measurements and capnographic waveform recording. The pre-treatment and post-treatment results were then compared with paired samples t-test analysis. Simple and canonical correlations were performed to determine correlations between the assessment methods. A p value of below 0.05 was taken to be significant.
Peak flow measurements showed significant improvements post-treatment (p < 0.001). On the capnographic waveform, there was a significant difference in the slope of phase 3 (p < 0.001) and alpha angle (p < 0.001), but not in phase 2 slope (p = 0.35). Correlation studies done between the assessment methods and indices readings did not show strong correlations either between the measurements or the magnitude of change pre-treatment and post-treatment.
Peak flow measurements and capnographic waveform indices can indicate improvements in airway diameter in acute asthmatics in the ED. Even though the two assessment methods did not correlate statistically, capnographic waveform analysis presents several advantages in that it is effort independent and provides continuous monitoring of normal tidal respiration. They can be proposed for the monitoring of asthmatics in the ED.
在急诊室对急性哮喘发作进行初始评估的常用方法包括使用峰值流速测量和临床参数。这两种方法都有各自的缺点,如患者配合度差(峰值流速仪)以及缺乏客观评估(临床参数)。我们正在研究用于哮喘初始评估的其他方法,即使用二氧化碳描记法。正常的二氧化碳图具有几乎为方波的模式,包括第1相、斜率第2相、平台期第3相、第4相和α角(在斜率2和3之间)。哮喘时的变化包括第2相斜率降低、第3相斜率增加以及α角增大。
我们的目的是比较和评估在急诊室就诊的未插管急性哮喘患者中,二氧化碳描记指标变化与峰值流速测量之间的相关性。
我们在一家大学医院急诊科进行了一项前瞻性研究。对128例急性哮喘患者进行峰值流速测量监测,然后连接鼻导管以进行呼出二氧化碳的微量采样。将二氧化碳图波形记录到PC卡上以进行指标分析。患者按照科室方案进行治疗。治疗后,当判定他们情况良好可出院时,获取第二组峰值流速测量结果和二氧化碳图波形记录。然后使用配对样本t检验分析比较治疗前和治疗后的结果。进行简单和典型相关性分析以确定评估方法之间的相关性。p值低于0.05被认为具有统计学意义。
峰值流速测量显示治疗后有显著改善(p < 0.001)。在二氧化碳图波形上,第3相斜率(p < 0.001)和α角(p < 0.001)有显著差异,但第2相斜率无显著差异(p = 0.35)。评估方法与指标读数之间的相关性研究在测量值之间或治疗前和治疗后的变化幅度之间均未显示出强相关性。
峰值流速测量和二氧化碳图波形指标可表明急诊科急性哮喘患者气道直径的改善。尽管这两种评估方法在统计学上不相关,但二氧化碳图波形分析具有几个优点,即它不依赖于患者的努力并且可对正常潮式呼吸进行连续监测。它们可被推荐用于急诊科哮喘患者的监测。