Zuurbier Moniek, Hoek Gerard, Oldenwening Marieke, Lenters Virissa, Meliefste Kees, van den Hazel Peter, Brunekreef Bert
Public Health Services Gelderland Midden, Arnhem, the Netherlands.
Environ Health Perspect. 2010 Jun;118(6):783-9. doi: 10.1289/ehp.0901622. Epub 2010 Feb 25.
Commuters are exposed to high concentrations of air pollutants, but little quantitative information is currently available on differences in exposure between different modes of transport, routes, and fuel types.
The aim of our study was to assess differences in commuters' exposure to traffic-related air pollution related to transport mode, route, and fuel type.
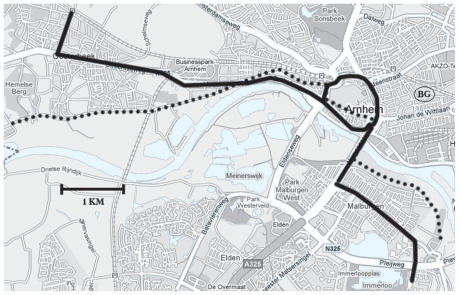
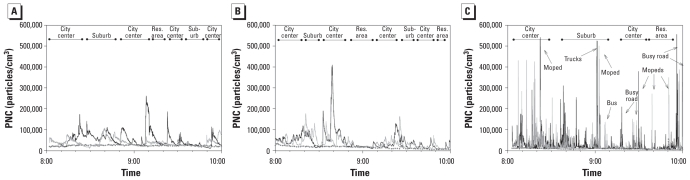
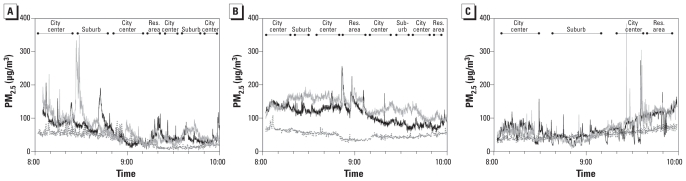
We measured particle number counts (PNCs) and concentrations of PM2.5 (particulate matter <or= 2.5 microm in aerodynamic diameter), PM10, and soot between June 2007 and June 2008 on 47 weekdays, from 0800 to 1000 hours, in diesel and electric buses, gasoline- and diesel-fueled cars, and along two bicycle routes with different traffic intensities in Arnhem, the Netherlands. In addition, each-day measurements were taken at an urban background location.
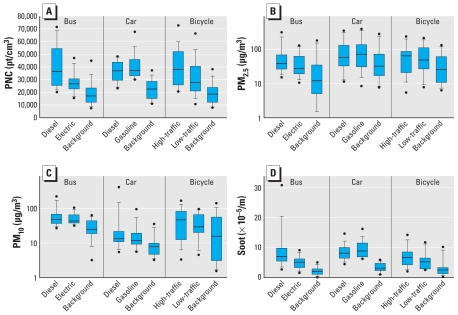
We found that median PNC exposures were highest in diesel buses (38,500 particles/cm3) and for cyclists along the high-traffic intensity route (46,600 particles/cm3) and lowest in electric buses (29,200 particles/cm3). Median PM10 exposure was highest from diesel buses (47 microg/m3) and lowest along the high- and low-traffic bicycle routes (39 and 37 microg/m3). The median soot exposure was highest in gasoline-fueled cars (9.0 x 10⁻⁵/m), diesel cars (7.9 x 10⁻⁵/m), and diesel buses (7.4 x 10⁻⁵/m) and lowest along the low-traffic bicycle route (4.9 x 10⁻⁵/m). Because the minute ventilation (volume of air per minute) of cyclists, which we estimated from measured heart rates, was twice the minute ventilation of car and bus passengers, we calculated that the inhaled air pollution doses were highest for cyclists. With the exception of PM10, we found that inhaled air pollution doses were lowest for electric bus passengers.
Commuters' rush hour exposures were significantly influenced by mode of transport, route, and fuel type.
通勤者暴露于高浓度的空气污染物中,但目前关于不同交通方式、路线和燃料类型之间暴露差异的定量信息很少。
我们研究的目的是评估通勤者在与交通相关的空气污染暴露方面与交通方式、路线和燃料类型的差异。
在2007年6月至2008年6月期间的47个工作日,从08:00至10:00,我们在荷兰阿纳姆的柴油和电动公交车、汽油和柴油汽车以及两条交通强度不同的自行车路线上测量了粒子数浓度(PNCs)以及PM2.5(空气动力学直径小于或等于2.5微米的颗粒物)、PM10和碳黑的浓度。此外,每天还在城市背景位置进行测量。
我们发现,柴油公交车中的PNC暴露中位数最高(38,500个颗粒/立方厘米),高交通强度路线上的骑行者次之(46,600个颗粒/立方厘米),电动公交车中最低(29,200个颗粒/立方厘米)。PM10暴露中位数在柴油公交车中最高(47微克/立方米),在高交通强度和低交通强度的自行车路线上最低(分别为39和37微克/立方米)。碳黑暴露中位数在汽油车(9.0×10⁻⁵/米)、柴油车(7.9×10⁻⁵/米)和柴油公交车(7.4×10⁻⁵/米)中最高,在低交通强度自行车路线上最低(4.9×10⁻⁵/米)。由于我们根据测量的心率估算出骑行者的分钟通气量(每分钟的空气体积)是汽车和公交车乘客的两倍,因此我们计算出骑行者吸入的空气污染剂量最高。除PM10外,我们发现电动公交车乘客吸入的空气污染剂量最低。
通勤者在高峰时段的暴露情况受到交通方式、路线和燃料类型的显著影响。