Department of Electrical and Computer Engineering, Iowa State University, Ames, IA, USA.
BMC Bioinformatics. 2010 Sep 17;11:469. doi: 10.1186/1471-2105-11-469.
Linking high-throughput experimental data with biological networks is a key step for understanding complex biological systems. Currently, visualization tools for large metabolic networks often result in a dense web of connections that is difficult to interpret biologically. The MetNetGE application organizes and visualizes biological networks in a meaningful way to improve performance and biological interpretability.
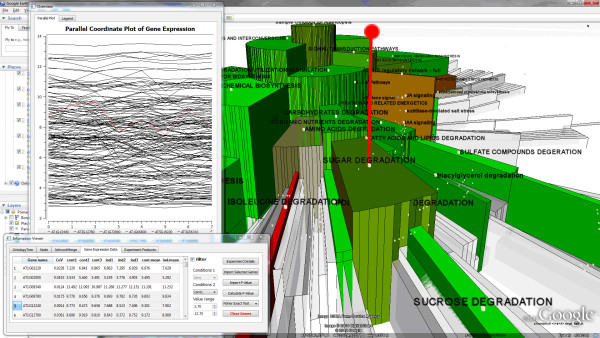
MetNetGE is an interactive visualization tool based on the Google Earth platform. MetNetGE features novel visualization techniques for pathway and ontology information display. Instead of simply showing hundreds of pathways in a complex graph, MetNetGE gives an overview of the network using the hierarchical pathway ontology using a novel layout, called the Enhanced Radial Space-Filling (ERSF) approach that allows the network to be summarized compactly. The non-tree edges in the pathway or gene ontology, which represent pathways or genes that belong to multiple categories, are linked using orbital connections in a third dimension. Biologists can easily identify highly activated pathways or gene ontology categories by mapping of summary experiment statistics such as coefficient of variation and overrepresentation values onto the visualization. After identifying such pathways, biologists can focus on the corresponding region to explore detailed pathway structure and experimental data in an aligned 3D tiered layout. In this paper, the use of MetNetGE is illustrated with pathway diagrams and data from E. coli and Arabidopsis.
MetNetGE is a visualization tool that organizes biological networks according to a hierarchical ontology structure. The ERSF technique assigns attributes in 3D space, such as color, height, and transparency, to any ontological structure. For hierarchical data, the novel ERSF layout enables the user to identify pathways or categories that are differentially regulated in particular experiments. MetNetGE also displays complex biological pathway in an aligned 3D tiered layout for exploration.
将高通量实验数据与生物网络联系起来是理解复杂生物系统的关键步骤。目前,用于大型代谢网络的可视化工具通常会导致连接非常密集,难以进行生物学解释。MetNetGE 应用程序以有意义的方式组织和可视化生物网络,以提高性能和生物学可解释性。
MetNetGE 是一个基于 Google Earth 平台的交互式可视化工具。MetNetGE 具有新颖的可视化技术,用于显示途径和本体信息。MetNetGE 不是简单地在复杂的图中显示数百条途径,而是使用新的布局,称为增强的径向空间填充 (ERSF) 方法,使用分层途径本体概述网络,该方法允许紧凑地总结网络。非树状边缘在途径或基因本体中,代表属于多个类别的途径或基因,使用第三维中的轨道连接链接。生物学家可以通过将汇总实验统计信息(例如变化系数和过表达值)映射到可视化上,轻松识别高度激活的途径或基因本体类别。识别出这些途径后,生物学家可以集中精力探索相应区域的详细途径结构和实验数据,以对齐的 3D 分层布局显示。本文使用大肠杆菌和拟南芥的途径图和数据说明了 MetNetGE 的使用。
MetNetGE 是一种根据层次本体结构组织生物网络的可视化工具。ERSF 技术在 3D 空间中分配属性,例如颜色、高度和透明度,到任何本体结构。对于层次数据,新颖的 ERSF 布局使用户能够识别在特定实验中差异调节的途径或类别。MetNetGE 还以对齐的 3D 分层布局显示复杂的生物途径,以进行探索。