Department of Public Health, Weill Cornell Medical College, New York, USA.
BMC Musculoskelet Disord. 2011 May 23;12:109. doi: 10.1186/1471-2474-12-109.
Standard mean imputation for missing values in the Western Ontario and Mc Master (WOMAC) Osteoarthritis Index limits the use of collected data and may lead to bias. Probability model-based imputation methods overcome such limitations but were never before applied to the WOMAC. In this study, we compare imputation results for the Expectation Maximization method (EM) and the mean imputation method for WOMAC in a cohort of total hip replacement patients.
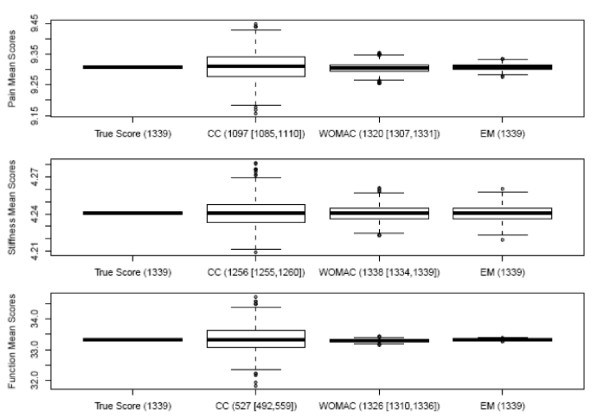
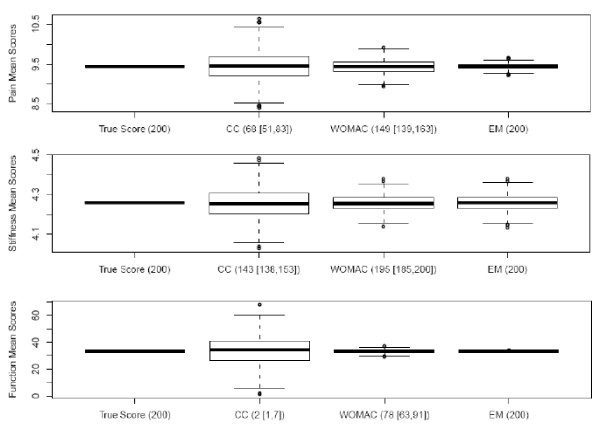
WOMAC data on a consecutive cohort of 2,062 patients scheduled for surgery were analyzed. Rates of missing values in each of the WOMAC items from this large cohort were used to create missing patterns in the subset of patients with complete data. EM and the WOMAC's method of imputation are then applied to fill the missing values. Summary score statistics for both methods are then described through box-plot and contrasted with the complete case (CC) analysis and the true score (TS). This process is repeated using a smaller sample size of 200 randomly drawn patients with higher missing rate (5 times the rates of missing values observed in the 2,062 patients capped at 45%).
Rate of missing values per item ranged from 2.9% to 14.5% and 1,339 patients had complete data. Probability model-based EM imputed a score for all subjects while WOMAC's imputation method did not. Mean subscale scores were very similar for both imputation methods and were similar to the true score; however, the EM method results were more consistent with the TS after simulation. This difference became more pronounced as the number of items in a subscale increased and the sample size decreased.
The EM method provides a better alternative to the WOMAC imputation method. The EM method is more accurate and imputes data to create a complete data set. These features are very valuable for patient-reported outcomes research in which resources are limited and the WOMAC score is used in a multivariate analysis.
在 Western Ontario and McMaster (WOMAC) 骨关节炎指数中,对缺失值进行标准均值插补会限制已收集数据的使用,并可能导致偏差。基于概率模型的插补方法克服了这些限制,但从未应用于 WOMAC。在这项研究中,我们比较了期望最大化法(EM)和 WOMAC 均值插补法在全髋关节置换患者队列中的插补结果。
分析了连续队列中 2062 例拟手术患者的 WOMAC 数据。利用该大队列中每个 WOMAC 项目的缺失值率,在完整数据患者的子集中创建缺失模式。然后应用 EM 和 WOMAC 的插补方法来填补缺失值。通过箱线图描述两种方法的综合评分统计数据,并与完全案例(CC)分析和真实得分(TS)进行对比。然后使用 200 名随机抽取的缺失率较高(缺失率观察到的 2062 名患者的 5 倍,上限为 45%)的患者的较小样本量重复该过程。
每个项目的缺失值率为 2.9%至 14.5%,有 1339 例患者具有完整数据。概率模型的 EM 为所有患者都插补了分数,而 WOMAC 的插补方法没有。两种插补方法的子量表平均得分非常相似,与真实得分相似;然而,经过模拟后,EM 方法的结果与 TS 更一致。随着子量表中项目数量的增加和样本量的减少,这种差异变得更加明显。
EM 方法是 WOMAC 插补方法的更好替代方法。EM 方法更准确,并且可以插补数据以创建完整数据集。在资源有限且 WOMAC 评分用于多变量分析的患者报告结局研究中,这些功能非常有价值。