Hospices Civils de Lyon, Pôle Information Médicale Evaluation Recherche, Lyon, France.
PLoS One. 2012;7(7):e41944. doi: 10.1371/journal.pone.0041944. Epub 2012 Jul 31.
Efforts to provide a valid picture of surgeons' individual performance evolution should frame their outcomes in relation to what is expected depending on their experience. We derived the learning curve of young thyroidectomy surgeons as a baseline to enable the accurate assessment of their individual outcomes and avoid erroneous conclusions that may derive from more traditional approaches.
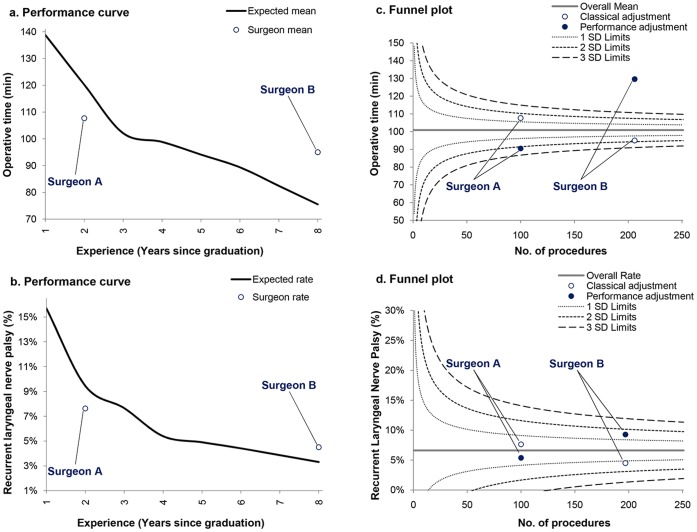
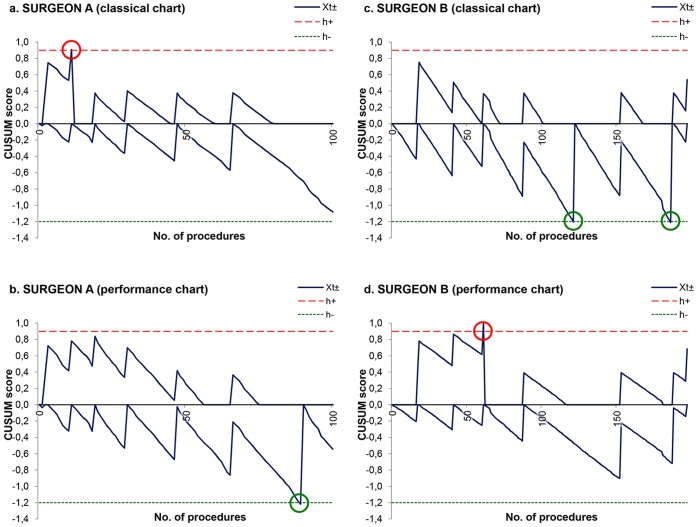
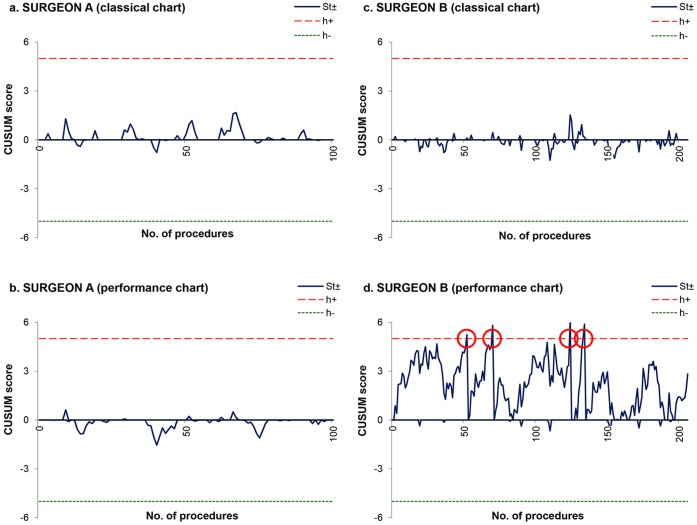
Operative time and postoperative recurrent laryngeal nerve palsy of 2006 patients who underwent a thyroidectomy performed by 19 young surgeons in five academic hospitals were monitored from April 2008 to December 2009. The database was randomly divided into training and testing datasets. The training data served to determine the expected performance curve of surgeons during their career and factors influencing outcome variation using generalized estimating equations (GEEs). To simulate prospective monitoring of individual surgeon outcomes, the testing data were plotted on funnel plots and cumulative sum charts (CUSUM). Performance charting methods were utilized to present outcomes adjusted both for patient case-mix and surgeon experience.
Generation of performance curves demonstrated a gradual reduction in operative time from 139 (95% CI, 137 to 141) to 75 (71 to 80) minutes, and from 15.7% (15.1% to 16.3%) to 3.3% (3.0% to 3.6%) regarding the nerve palsy rate. Charts interpretation revealed that a very young surgeon had better outcomes than expected, whereas a more experienced surgeon appeared to be a poor performer given the number of years that he had already spent in practice.
Not considering the initial learning curve of surgeons exposes them to biased measurement and to misinterpretation in assessing their individual performance for thyroidectomy. The performance chart represents a valuable tool to monitor the outcome of surgeons with the expectation to provide safe and efficient care to patients.
为了提供外科医生个人绩效演变的有效图景,应根据他们的经验,将其结果与预期结果进行对比。我们得出了年轻甲状腺外科医生的学习曲线,作为基准,以准确评估他们的个人结果,并避免因更传统的方法而产生错误的结论。
2008 年 4 月至 2009 年 12 月,监测了 19 名年轻外科医生在 5 家学术医院进行的 2006 例甲状腺切除术的手术时间和术后喉返神经麻痹。数据库被随机分为训练和测试数据集。训练数据用于使用广义估计方程(GEE)确定外科医生在职业生涯中的预期表现曲线和影响结果变化的因素。为了模拟对个别外科医生结果的前瞻性监测,将测试数据绘制成漏斗图和累积和图(CUSUM)。使用表现图表方法,对患者病例组合和外科医生经验进行了调整,以呈现结果。
表现曲线的生成表明,手术时间从 139 分钟(95%置信区间,137 至 141 分钟)逐渐减少到 75 分钟(71 至 80 分钟),神经麻痹率从 15.7%(15.1%至 16.3%)减少到 3.3%(3.0%至 3.6%)。图表解释表明,一位非常年轻的外科医生的结果好于预期,而一位经验更丰富的外科医生的表现似乎不佳,因为他已经在实践中工作了多年。
不考虑外科医生的初始学习曲线会使他们面临有偏差的测量和在评估他们的个人甲状腺切除术表现时的误解。表现图表是一种有价值的工具,可以监测外科医生的结果,以期为患者提供安全有效的护理。