• 文献检索
  • 文档翻译
  • 深度研究
  • 学术资讯
  • Suppr Zotero 插件Zotero 插件
  • 邀请有礼
  • 套餐&价格
  • 历史记录
应用&插件
Suppr Zotero 插件Zotero 插件浏览器插件Mac 客户端Windows 客户端微信小程序
定价
高级版会员购买积分包购买API积分包
服务
文献检索文档翻译深度研究API 文档MCP 服务
关于我们
关于 Suppr公司介绍联系我们用户协议隐私条款
关注我们

Suppr 超能文献

核心技术专利:CN118964589B侵权必究
粤ICP备2023148730 号-1Suppr @ 2026

文献检索

告别复杂PubMed语法,用中文像聊天一样搜索,搜遍4000万医学文献。AI智能推荐,让科研检索更轻松。

立即免费搜索

文件翻译

保留排版,准确专业,支持PDF/Word/PPT等文件格式,支持 12+语言互译。

免费翻译文档

深度研究

AI帮你快速写综述,25分钟生成高质量综述,智能提取关键信息,辅助科研写作。

立即免费体验

可归因死亡率作为意大利医疗服务绩效指标。

Amenable mortality as a performance indicator of Italian health-care services.

机构信息

Department of Medicine and Public Health, Alma Mater Studiorum, University of Bologna, Bologna, 40126, Italy.

出版信息

BMC Health Serv Res. 2012 Sep 10;12:310. doi: 10.1186/1472-6963-12-310.

DOI:10.1186/1472-6963-12-310
PMID:22963259
原文链接:https://pmc.ncbi.nlm.nih.gov/articles/PMC3506466/
Abstract

BACKGROUND

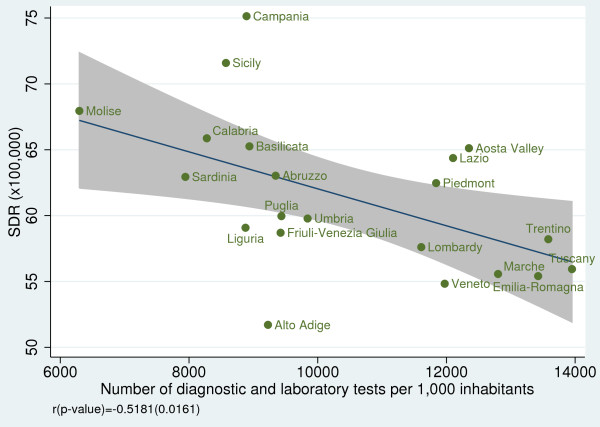
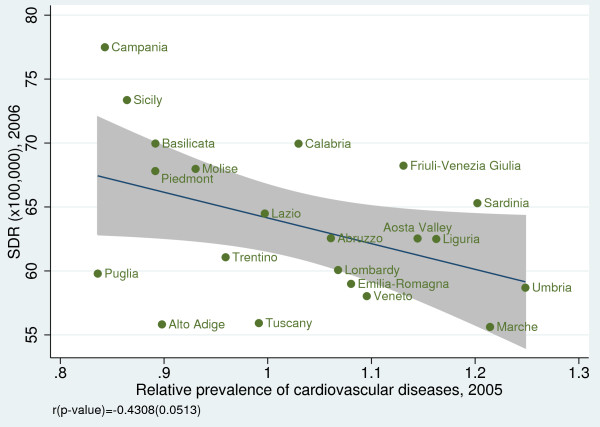
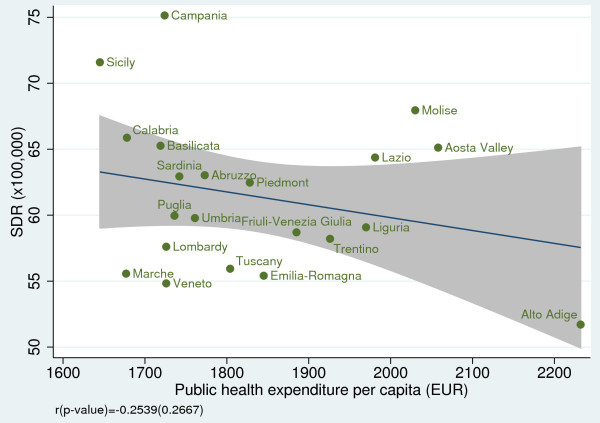
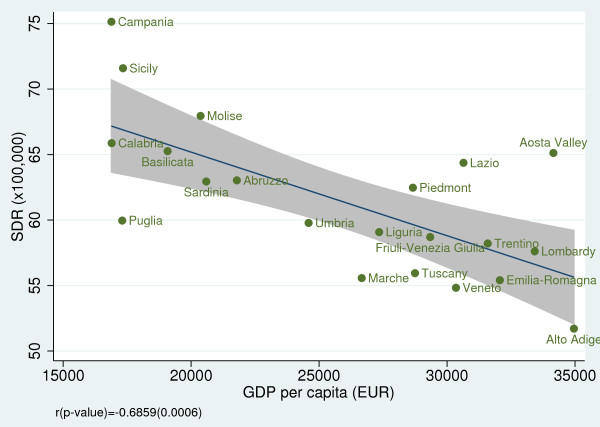
Mortality amenable to health-care services ('amenable mortality') has been defined as "premature deaths that should not occur in the presence of timely and effective health care" and as "conditions for which effective clinical interventions exist." We analyzed the regional variability in health-care services using amenable mortality as a performance indicator. Convergent validity was examined against other indicators, such as health expenditure, GDP per capita, life expectancy at birth, disability-free life expectancy at age 15, number of diagnostic and laboratory tests per 1,000 inhabitants, and the prevalence of cancer and cardiovascular diseases.

METHODS

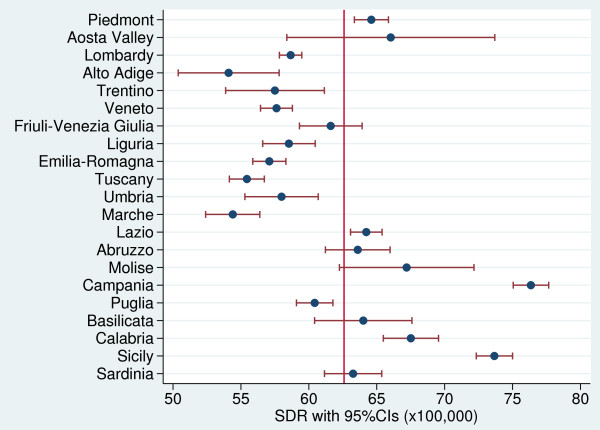
Amenable mortality rate was calculated as the average annual number of deaths in the population aged 0-74 years per 100,000 inhabitants, and it was then stratified by gender and region. Data were drawn from national mortality statistics for the period 2006-08.

RESULTS

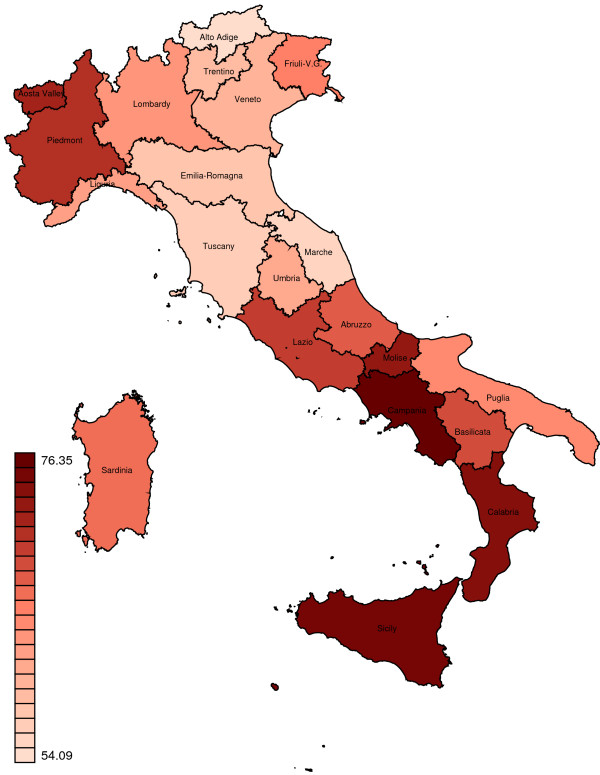
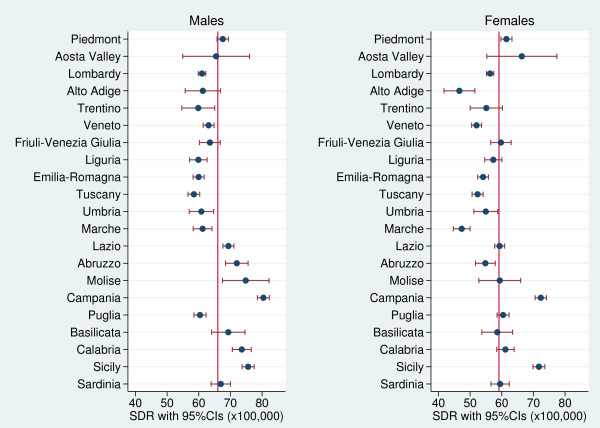
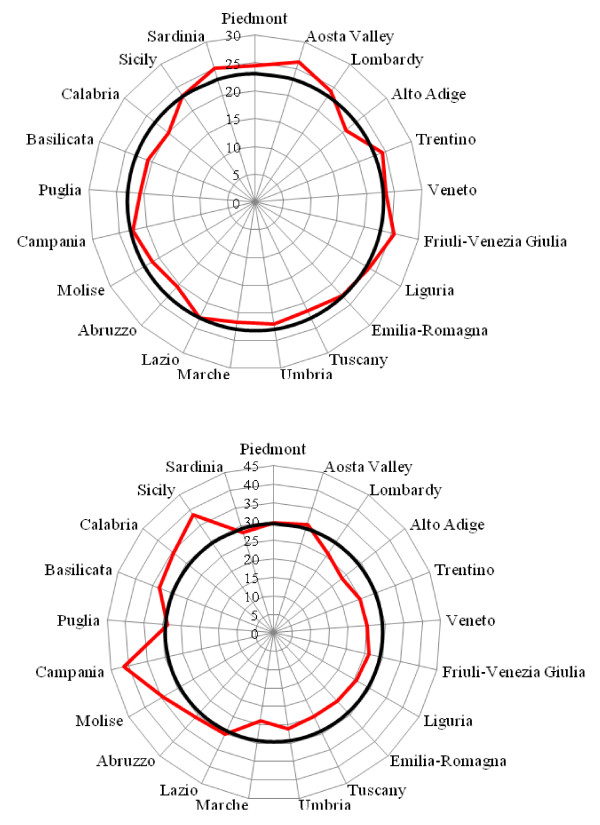
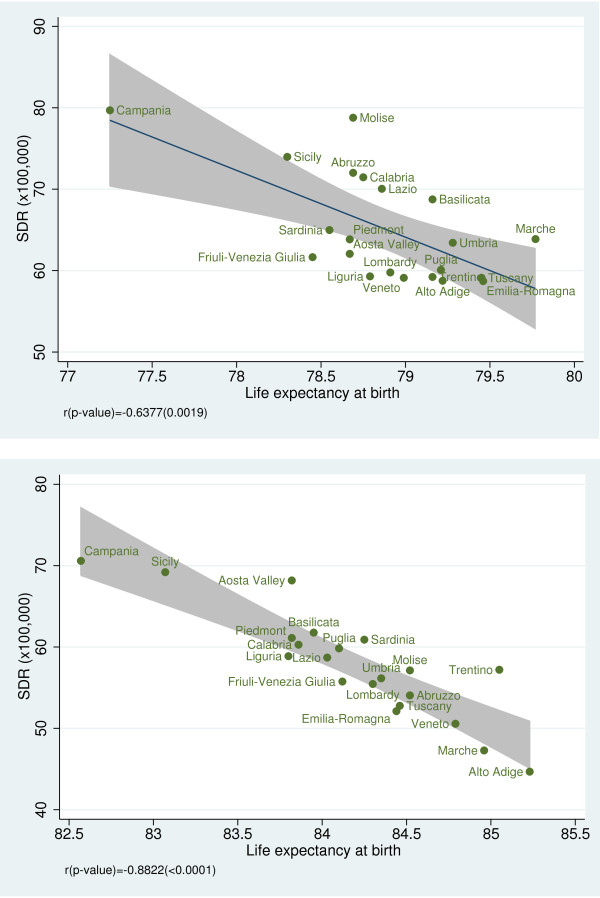
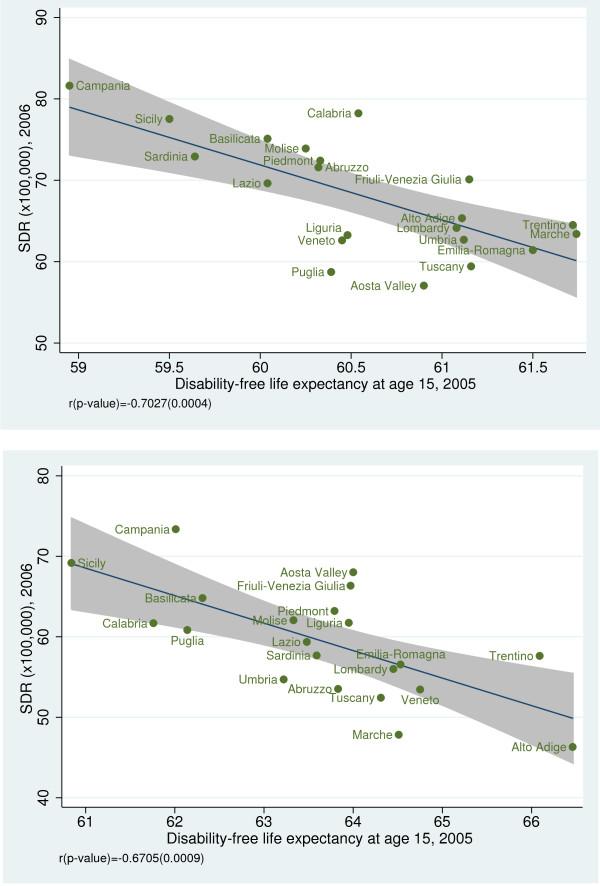
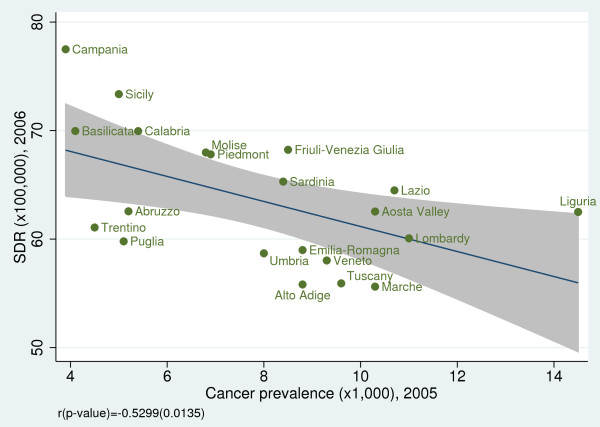
During the study period (2006-08), the age-standardized death rate (SDR) amenable to health-care services in Italy was 62.6 per 100,000 inhabitants: 66.0 per 100,000 for males and 59.1 per 100,000 for females. Significant regional variations ranged from 54.1 per 100,000 inhabitants in Alto Adige to 76.3 per 100,000 in Campania. Regional variability in SDR was examined separately for male and females. The variability proved to be statistically significant for both males and females (males: Q-test = 638.5, p < 0.001; females: Q-test = 700.1, p < 0.001). However, among men, we found a clear-cut divide in SDR values between Central and Southern Italy; among women, this divide was less pronounced. Amenable mortality was negatively correlated with life expectancy at birth for both genders (male: r = -0.64, p = 0.002; female: r = -0.88, p <0.001) and with disability-free life expectancy at age 15 (male: r = -0.70, p <0.001; female: r = -0.67, p <0.001). Amenable mortality displayed a statistically significant negative relationship with GDP per capita, the quantity of diagnostic and laboratory tests per 1,000 inhabitants, and the prevalence of cancer.

CONCLUSIONS

Amenable mortality shows a wide variation across Italian regions and an inverse relationship with life expectancy and GDP per capita, as expected.

摘要

背景

可归因于医疗保健服务的死亡率(“可归因死亡率”)被定义为“在及时和有效的医疗保健存在的情况下,不应该发生的过早死亡”和“存在有效临床干预的情况”。我们使用可归因死亡率作为绩效指标来分析区域间医疗保健服务的差异。收敛有效性是通过其他指标来检验的,如卫生支出、人均国内生产总值、出生时的预期寿命、15 岁时无残疾预期寿命、每 1000 居民的诊断和实验室检查数量以及癌症和心血管疾病的患病率。

方法

可归因死亡率率计算为每 100000 名 0-74 岁人群中每年的平均死亡人数,然后按性别和地区进行分层。数据来自 2006-08 年的国家死亡率统计数据。

结果

在研究期间(2006-08 年),意大利的医疗保健服务可归因的标准化死亡率(SDR)为每 100000 居民 62.6 人:男性为每 100000 居民 66.0 人,女性为每 100000 居民 59.1 人。从 54.1 人/100000 居民在阿迪杰到 76.3 人/100000 居民在坎帕尼亚,地区差异显著。分别为男性和女性检查 SDR 的地区差异。对于男性和女性,这种差异具有统计学意义(男性:Q 检验=638.5,p<0.001;女性:Q 检验=700.1,p<0.001)。然而,在男性中,我们发现中南部意大利的 SDR 值之间存在明显的差异;在女性中,这种差异不那么明显。可归因死亡率与出生时的预期寿命呈负相关,对于两性(男性:r=-0.64,p=0.002;女性:r=-0.88,p<0.001)和 15 岁时的无残疾预期寿命(男性:r=-0.70,p<0.001;女性:r=-0.67,p<0.001)。可归因死亡率与人均国内生产总值、每 1000 居民的诊断和实验室检查数量以及癌症的患病率呈统计学显著负相关。

结论

可归因死亡率在意大利各地区差异很大,与预期的预期寿命和人均国内生产总值呈负相关。

https://cdn.ncbi.nlm.nih.gov/pmc/blobs/df3c/3506466/12e792944a6c/1472-6963-12-310-11.jpg
https://cdn.ncbi.nlm.nih.gov/pmc/blobs/df3c/3506466/db1d23486583/1472-6963-12-310-1.jpg
https://cdn.ncbi.nlm.nih.gov/pmc/blobs/df3c/3506466/b7b9a72d028a/1472-6963-12-310-2.jpg
https://cdn.ncbi.nlm.nih.gov/pmc/blobs/df3c/3506466/cba4585a3991/1472-6963-12-310-3.jpg
https://cdn.ncbi.nlm.nih.gov/pmc/blobs/df3c/3506466/7d2676c93b93/1472-6963-12-310-4.jpg
https://cdn.ncbi.nlm.nih.gov/pmc/blobs/df3c/3506466/2843cc8d6a8d/1472-6963-12-310-5.jpg
https://cdn.ncbi.nlm.nih.gov/pmc/blobs/df3c/3506466/01822eaec1a9/1472-6963-12-310-6.jpg
https://cdn.ncbi.nlm.nih.gov/pmc/blobs/df3c/3506466/b489cacba010/1472-6963-12-310-7.jpg
https://cdn.ncbi.nlm.nih.gov/pmc/blobs/df3c/3506466/a5d2e927c581/1472-6963-12-310-8.jpg
https://cdn.ncbi.nlm.nih.gov/pmc/blobs/df3c/3506466/b6638a05c739/1472-6963-12-310-9.jpg
https://cdn.ncbi.nlm.nih.gov/pmc/blobs/df3c/3506466/61c894884fa7/1472-6963-12-310-10.jpg
https://cdn.ncbi.nlm.nih.gov/pmc/blobs/df3c/3506466/12e792944a6c/1472-6963-12-310-11.jpg

相似文献

1
Amenable mortality as a performance indicator of Italian health-care services.可归因死亡率作为意大利医疗服务绩效指标。
BMC Health Serv Res. 2012 Sep 10;12:310. doi: 10.1186/1472-6963-12-310.
2
Mortality Amenable to Health Care in European Union Countries and Its Limitations.欧盟国家中可通过医疗保健避免的死亡率及其局限性。
Cent Eur J Public Health. 2017 Dec;25 Suppl 2:S16-S22. doi: 10.21101/cejph.a4956.
3
[State of health of populations residing in geothermal areas of Tuscany].[托斯卡纳地热区居民的健康状况]
Epidemiol Prev. 2012 Sep-Oct;36(5 Suppl 1):1-104.
4
Italian cancer figures, report 2012: Cancer in children and adolescents.《2012年意大利癌症数据报告:儿童和青少年癌症》
Epidemiol Prev. 2013 Jan-Feb;37(1 Suppl 1):1-225.
5
[Life expectancy at birth and mortality in Brazil, 1999: exploratory analysis of regional differences].[1999年巴西的出生时预期寿命和死亡率:区域差异的探索性分析]
Rev Panam Salud Publica. 2002 Dec;12(6):436-44. doi: 10.1590/s1020-49892002001200009.
6
[Mortality amenable to health care services and health inequalities among Italian Regions].[意大利各地区可通过医疗保健服务避免的死亡率及健康不平等情况]
Epidemiol Prev. 2014 Mar-Apr;38(2):100-7.
7
[Contribution of amenable mortality to the decrease of overall mortality in Piedmont Region (Northern Italy), 1980-2011].[1980 - 2011年皮埃蒙特地区(意大利北部)可避免死亡率对总体死亡率下降的贡献]
Epidemiol Prev. 2016 Nov-Dec;40(6):418-426. doi: 10.19191/EP16.6.P418.122.
8
The East-West life expectancy gap: differences in mortality from conditions amenable to medical intervention.东西方预期寿命差距:可通过医疗干预改善的疾病导致的死亡率差异。
Int J Epidemiol. 1997 Feb;26(1):75-84. doi: 10.1093/ije/26.1.75.
9
[Mortality Atlas of the Campania Region. All-cause and cause-specific mortality at municipal level, 2006-2014].[坎帕尼亚大区死亡率地图集。2006 - 2014年市级全因死亡率和特定病因死亡率]
Epidemiol Prev. 2020 Jan-Feb;44(1 Suppl 1):1-144. doi: 10.19191/EP20.1.S1.P001.003.
10
Italian cancer figures--Report 2015: The burden of rare cancers in Italy.意大利癌症数据——2015年报告:意大利罕见癌症的负担
Epidemiol Prev. 2016 Jan-Feb;40(1 Suppl 2):1-120. doi: 10.19191/EP16.1S2.P001.035.

引用本文的文献

1
Regional variations in Italy's COVID-19 death toll: a descriptive analysis of excess mortality and associated factors from 2020 to 2021.意大利新冠肺炎死亡人数的地区差异:对2020年至2021年超额死亡率及相关因素的描述性分析
Popul Health Metr. 2025 Mar 7;23(1):9. doi: 10.1186/s12963-025-00370-4.
2
How much do local health systems matter? Variations in amenable mortality across health districts in Aotearoa New Zealand.地方卫生系统有多重要?新西兰奥特亚罗瓦各卫生区可避免死亡率的差异。
Public Health Pract (Oxf). 2024 Aug 26;8:100545. doi: 10.1016/j.puhip.2024.100545. eCollection 2024 Dec.
3
Understanding the relationships between health spending, treatable mortality and economic productivity in OECD countries.

本文引用的文献

1
Mortality amenable to health care and its relation to socio-economic status in Hungary, 2004-08.2004-2008 年匈牙利可通过医疗保健改善的死亡率及其与社会经济地位的关系
Eur J Public Health. 2012 Oct;22(5):620-4. doi: 10.1093/eurpub/ckr143. Epub 2011 Sep 30.
2
Measuring integrated care.衡量整合式照护。
Dan Med Bull. 2011 Feb;58(2):B4245.
3
Are men shortchanged on health? Perspective on health care utilization and health risk behavior in men and women in the United States.男性在健康方面是否受到亏待?美国男性和女性的医疗保健利用和健康风险行为透视。
了解经合组织国家卫生支出、可治疗死亡率和经济生产力之间的关系。
Front Public Health. 2022 Dec 21;10:1036058. doi: 10.3389/fpubh.2022.1036058. eCollection 2022.
4
Death by austerity? The impact of cost containment on avoidable mortality in Italy. austerity 导致死亡?成本控制对意大利可避免死亡率的影响。
Health Econ. 2020 Dec;29(12):1500-1516. doi: 10.1002/hec.4147. Epub 2020 Aug 17.
5
Patterns of amenable child mortality over time in 34 member countries of the Organisation for Economic Co-operation and Development (OECD): evidence from a 15-year time trend analysis (2001-2015).34 个经济合作与发展组织(经合组织)成员国在可避免儿童死亡方面的时间变化趋势:15 年时间趋势分析(2001-2015 年)的证据。
BMJ Open. 2019 May 22;9(5):e027909. doi: 10.1136/bmjopen-2018-027909.
6
Trends in amenable mortality rate in the Mongolian population, 2007-2014.2007 - 2014年蒙古人口中可避免死亡率的趋势
Nagoya J Med Sci. 2016 Feb;78(1):55-68.
Int J Clin Pract. 2010 Mar;64(4):475-87. doi: 10.1111/j.1742-1241.2009.02290.x.
4
Is the Kaiser Permanente model superior in terms of clinical integration?: a comparative study of Kaiser Permanente, Northern California and the Danish healthcare system.从临床整合的角度来看,凯撒医疗模式是否更优越?——对凯撒医疗、北加利福尼亚和丹麦医疗体系的比较研究。
BMC Health Serv Res. 2010 Apr 8;10:91. doi: 10.1186/1472-6963-10-91.
5
Hip fracture: effectiveness of early surgery to prevent 30-day mortality.髋部骨折:早期手术预防 30 天死亡率的效果。
Int Orthop. 2011 Mar;35(3):419-24. doi: 10.1007/s00264-010-1004-x. Epub 2010 Apr 8.
6
How much does health care contribute to health gain and to health inequality? Trends in amenable mortality in New Zealand 1981-2004.医疗保健对健康改善和健康不平等有多大贡献?1981 - 2004年新西兰可避免死亡率趋势。
Aust N Z J Public Health. 2009 Feb;33(1):70-8. doi: 10.1111/j.1753-6405.2009.00342.x.
7
Measuring the health of nations: updating an earlier analysis.衡量各国的健康状况:更新早期分析。
Health Aff (Millwood). 2008 Jan-Feb;27(1):58-71. doi: 10.1377/hlthaff.27.1.58.
8
The Italian health-care system.意大利医疗保健系统。
Health Econ. 2005 Sep;14(Suppl 1):S187-202. doi: 10.1002/hec.1035.
9
What can the UK and US health systems learn from each other?英国和美国的医疗体系能从彼此身上学到什么?
BMJ. 2005 Mar 5;330(7490):530-3. doi: 10.1136/bmj.330.7490.530.
10
Measuring the health of nations: analysis of mortality amenable to health care.衡量各国健康状况:对可通过医疗保健改善的死亡率进行分析。
BMJ. 2003 Nov 15;327(7424):1129. doi: 10.1136/bmj.327.7424.1129.