• 文献检索
  • 文档翻译
  • 深度研究
  • 学术资讯
  • Suppr Zotero 插件Zotero 插件
  • 邀请有礼
  • 套餐&价格
  • 历史记录
应用&插件
Suppr Zotero 插件Zotero 插件浏览器插件Mac 客户端Windows 客户端微信小程序
定价
高级版会员购买积分包购买API积分包
服务
文献检索文档翻译深度研究API 文档MCP 服务
关于我们
关于 Suppr公司介绍联系我们用户协议隐私条款
关注我们

Suppr 超能文献

核心技术专利:CN118964589B侵权必究
粤ICP备2023148730 号-1Suppr @ 2026

文献检索

告别复杂PubMed语法,用中文像聊天一样搜索,搜遍4000万医学文献。AI智能推荐,让科研检索更轻松。

立即免费搜索

文件翻译

保留排版,准确专业,支持PDF/Word/PPT等文件格式,支持 12+语言互译。

免费翻译文档

深度研究

AI帮你快速写综述,25分钟生成高质量综述,智能提取关键信息,辅助科研写作。

立即免费体验

运用经验贝叶斯方法对人口健康指标进行县排名。

Using empirical Bayes methods to rank counties on population health measures.

机构信息

New York University School of Medicine, 645 Translational Research Building, 227 East 30th St, New York, NY 10016, USA.

出版信息

Prev Chronic Dis. 2013 Aug 1;10:E129. doi: 10.5888/PCD10.130028.

DOI:10.5888/PCD10.130028
PMID:23906329
原文链接:https://pmc.ncbi.nlm.nih.gov/articles/PMC3733480/
Abstract

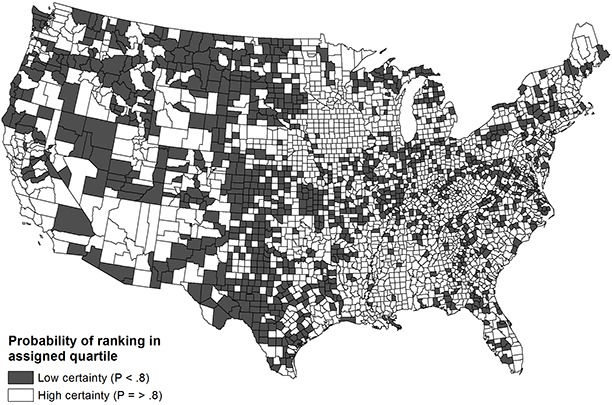
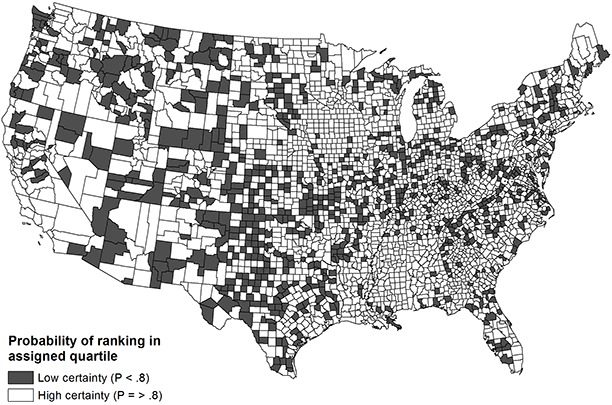
University of Wisconsin Population Health Institute has published County Health Rankings (The Rankings) since 2010. These rankings use population-based data to highlight variation in health and encourage health assessment for all US counties. However, the uncertainty of estimates remains a limitation. We sought to quantify the precision of The Rankings for selected measures. We developed hierarchical models for 5 health outcome measures and applied empirical Bayes methods to obtain county rank estimates for a composite health outcome measure. We compared results using models with and without demographic fixed effects to determine whether covariates improved rank precision. Counties whose rank had wide confidence intervals had smaller populations or ranked in the middle of all counties for health outcomes. Incorporating covariates in the models produced narrower intervals, but rank estimates remained imprecise for many counties. Local health officials, especially in smaller population and mid-performing communities, should consider these limitations when interpreting the results of The Rankings.

摘要

威斯康星大学人口健康研究所自 2010 年以来发布了县健康排名(排名)。这些排名使用基于人口的数据来突出健康方面的差异,并鼓励对美国所有县进行健康评估。然而,估计的不确定性仍然是一个限制。我们试图量化排名中选定指标的精度。我们为 5 个健康结果指标开发了层次模型,并应用经验贝叶斯方法为综合健康结果指标获得县排名估计。我们比较了使用具有和不具有人口统计固定效应的模型的结果,以确定协变量是否可以提高排名精度。排名置信区间较宽的县人口较少,或者在所有县中排名居中。在模型中纳入协变量会产生更窄的区间,但许多县的排名估计仍然不够精确。当地卫生官员,尤其是在人口较少和表现中等的社区,在解释排名结果时应考虑到这些限制。

https://cdn.ncbi.nlm.nih.gov/pmc/blobs/0fcf/3733480/09509a67b525/PCD-10-E129s02.jpg
https://cdn.ncbi.nlm.nih.gov/pmc/blobs/0fcf/3733480/460da51e27af/PCD-10-E129s01.jpg
https://cdn.ncbi.nlm.nih.gov/pmc/blobs/0fcf/3733480/09509a67b525/PCD-10-E129s02.jpg
https://cdn.ncbi.nlm.nih.gov/pmc/blobs/0fcf/3733480/460da51e27af/PCD-10-E129s01.jpg
https://cdn.ncbi.nlm.nih.gov/pmc/blobs/0fcf/3733480/09509a67b525/PCD-10-E129s02.jpg

相似文献

1
Using empirical Bayes methods to rank counties on population health measures.运用经验贝叶斯方法对人口健康指标进行县排名。
Prev Chronic Dis. 2013 Aug 1;10:E129. doi: 10.5888/PCD10.130028.
2
Improving the Rank Precision of Population Health Measures for Small Areas with Longitudinal and Joint Outcome Models.利用纵向和联合结果模型提高小区域人群健康指标的排序精度。
PLoS One. 2015 Jun 22;10(6):e0130027. doi: 10.1371/journal.pone.0130027. eCollection 2015.
3
Measuring the spatial distribution of health rankings in the United States.测量美国健康排名的空间分布。
Health Econ. 2021 Nov;30(11):2921-2936. doi: 10.1002/hec.4416. Epub 2021 Sep 2.
4
The County Health Rankings: rationale and methods.《县健康排名:原理与方法》
Popul Health Metr. 2015 Apr 17;13:11. doi: 10.1186/s12963-015-0044-2. eCollection 2015.
5
Comparison of US County-Level Public Health Performance Rankings With County Cluster and National Rankings: Assessment Based on Prevalence Rates of Smoking and Obesity and Motor Vehicle Crash Death Rates.美国县一级公共卫生绩效排名与县聚类和全国排名的比较:基于吸烟和肥胖患病率以及机动车事故死亡率的评估。
JAMA Netw Open. 2019 Jan 4;2(1):e186816. doi: 10.1001/jamanetworkopen.2018.6816.
6
Modeling Area-Level Health Rankings.区域健康排名建模。
Health Serv Res. 2015 Oct;50(5):1413-31. doi: 10.1111/1475-6773.12352. Epub 2015 Aug 9.
7
Ranking community health status to stimulate discussion of local public health issues: the Wisconsin County Health Rankings.对社区健康状况进行排名以激发对当地公共卫生问题的讨论:威斯康星州县域健康排名。
Am J Public Health. 2008 Feb;98(2):209-12. doi: 10.2105/AJPH.2006.092981. Epub 2008 Jan 2.
8
Using the County Health Rankings Framework to Create National Percentile Scores for Health Outcomes and Health Factors.利用县健康排名框架创建健康结果和健康因素的全国百分位分数。
Perm J. 2020 Dec;25:1. doi: 10.7812/TPP/20.012.
9
Using the Wisconsin County Health Rankings to catalyze community health improvement.利用威斯康星州县域健康排名促进社区健康改善。
J Public Health Manag Pract. 2009 Jan-Feb;15(1):24-32. doi: 10.1097/PHH.0b013e3181903bf8.
10
"Top Performing" US Hospitals and the Health Status of Counties they Serve.“表现最佳”的美国医院及其服务的县的健康状况。
J Community Health. 2018 Jun;43(3):477-487. doi: 10.1007/s10900-017-0440-6.

引用本文的文献

1
Ranking composite Cancer Burden Indices for geographic regions: point and interval estimates.地理区域综合癌症负担指数排名:点估计和区间估计
Cancer Causes Control. 2018 Feb;29(2):279-287. doi: 10.1007/s10552-018-1000-9. Epub 2018 Jan 25.
2
Modeling Area-Level Health Rankings.区域健康排名建模。
Health Serv Res. 2015 Oct;50(5):1413-31. doi: 10.1111/1475-6773.12352. Epub 2015 Aug 9.
3
County Health Rankings and the Cult of the Imperfect.县卫生排名与对不完美的崇拜。

本文引用的文献

1
Measuring the health of communities--how and why?衡量社区健康状况——方法与原因?
J Public Health Manag Pract. 2011 Sep-Oct;17(5):397-400. doi: 10.1097/PHH.0b013e318222b897.
2
Falling behind: life expectancy in US counties from 2000 to 2007 in an international context.落后:2000 年至 2007 年美国各县的预期寿命置于国际背景下
Popul Health Metr. 2011 Jun 15;9(1):16. doi: 10.1186/1478-7954-9-16.
3
A novel framework for validating and applying standardized small area measurement strategies.一种用于验证和应用标准化小区域测量策略的新框架。
Health Serv Res. 2015 Oct;50(5):1407-12. doi: 10.1111/1475-6773.12351. Epub 2015 Aug 9.
4
Improving the Rank Precision of Population Health Measures for Small Areas with Longitudinal and Joint Outcome Models.利用纵向和联合结果模型提高小区域人群健康指标的排序精度。
PLoS One. 2015 Jun 22;10(6):e0130027. doi: 10.1371/journal.pone.0130027. eCollection 2015.
5
Big data for population-based cancer research: the integrated cancer information and surveillance system.基于人群的癌症研究大数据:综合癌症信息与监测系统
N C Med J. 2014 Jul-Aug;75(4):265-9. doi: 10.18043/ncm.75.4.265.
Popul Health Metr. 2010 Sep 29;8:26. doi: 10.1186/1478-7954-8-26.
4
Social capital and rates of gonorrhea and syphilis in the United States: spatial regression analyses of state-level associations.美国的社会资本与淋病和梅毒发病率:州级关联的空间回归分析
Soc Sci Med. 2007 Jun;64(11):2324-41. doi: 10.1016/j.socscimed.2007.02.023. Epub 2007 Apr 2.
5
Variation in access to health care for different racial/ethnic groups by the racial/ethnic composition of an individual's county of residence.根据个人居住县的种族/族裔构成,不同种族/族裔群体获得医疗保健服务的差异。
Med Care. 2004 Jul;42(7):707-14. doi: 10.1097/01.mlr.0000129906.95881.83.
6
Comparison of small-area analysis techniques for estimating county-level outcomes.用于估计县级结果的小区域分析技术比较
Am J Prev Med. 2004 Jun;26(5):453-60. doi: 10.1016/j.amepre.2004.02.004.
7
Who's number one? The impact of variability on rankings based on public health indicators.谁是第一名?变异性对基于公共卫生指标的排名的影响。
Public Health Rep. 2001 Mar-Apr;116(2):158-64. doi: 10.1093/phr/116.2.158.
8
Methodological alternatives for measuring premature mortality.衡量过早死亡率的方法选择。
Am J Prev Med. 1988 Sep-Oct;4(5):268-73.