• 文献检索
  • 文档翻译
  • 深度研究
  • 学术资讯
  • Suppr Zotero 插件Zotero 插件
  • 邀请有礼
  • 套餐&价格
  • 历史记录
应用&插件
Suppr Zotero 插件Zotero 插件浏览器插件Mac 客户端Windows 客户端微信小程序
定价
高级版会员购买积分包购买API积分包
服务
文献检索文档翻译深度研究API 文档MCP 服务
关于我们
关于 Suppr公司介绍联系我们用户协议隐私条款
关注我们

Suppr 超能文献

核心技术专利:CN118964589B侵权必究
粤ICP备2023148730 号-1Suppr @ 2026

文献检索

告别复杂PubMed语法,用中文像聊天一样搜索,搜遍4000万医学文献。AI智能推荐,让科研检索更轻松。

立即免费搜索

文件翻译

保留排版,准确专业,支持PDF/Word/PPT等文件格式,支持 12+语言互译。

免费翻译文档

深度研究

AI帮你快速写综述,25分钟生成高质量综述,智能提取关键信息,辅助科研写作。

立即免费体验

抑郁脑电的频谱不对称性和 Higuchi 的分形维数测量。

Spectral asymmetry and Higuchi's fractal dimension measures of depression electroencephalogram.

机构信息

Department of Biomedical Engineering, Technomedicum of the Tallinn University of Technology, 5 Ehitajate Road, 19086 Tallinn, Estonia.

出版信息

Comput Math Methods Med. 2013;2013:251638. doi: 10.1155/2013/251638. Epub 2013 Oct 22.

DOI:10.1155/2013/251638
PMID:24232245
原文链接:https://pmc.ncbi.nlm.nih.gov/articles/PMC3819823/
Abstract

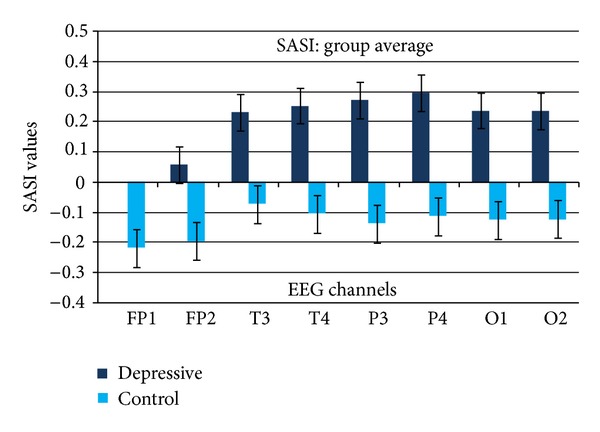
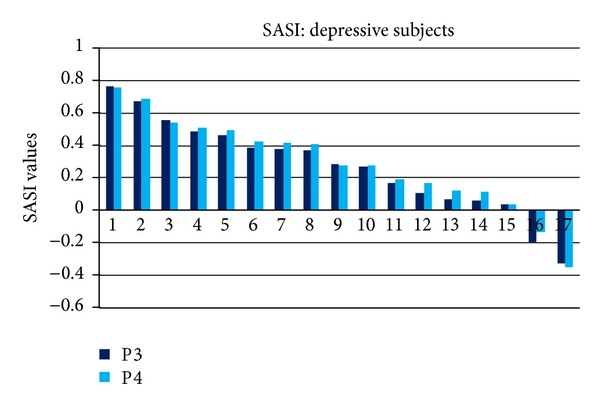
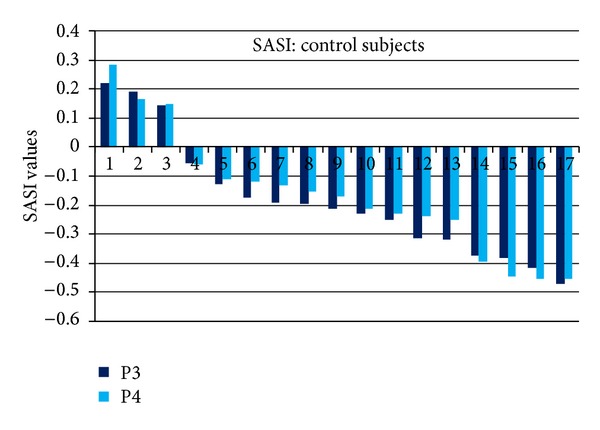
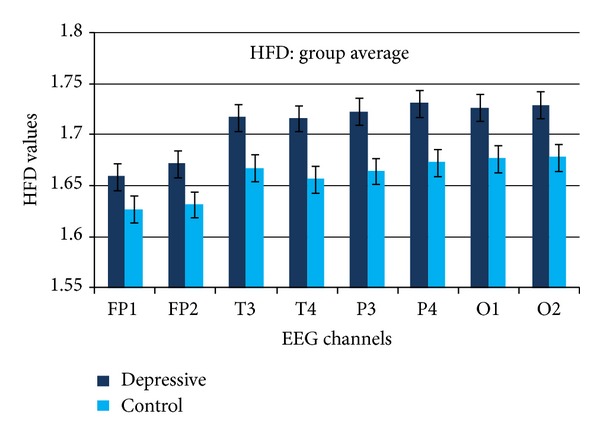
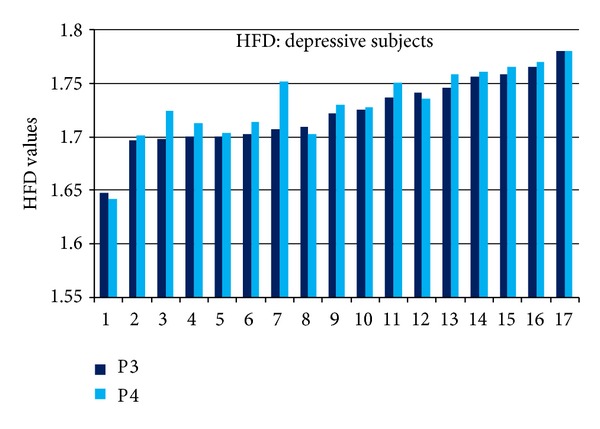
This study was aimed to compare two electroencephalogram (EEG) analysis methods, spectral asymmetry index (SASI) and Higuchi's fractal dimension (HFD), for detection of depression. Linear SASI method is based on evaluation of the balance of powers in two EEG frequency bands in one channel selected higher and lower than the alpha band spectrum maximum. Nonlinear HFD method calculates fractal dimension directly in the time domain. The resting EEG signals of 17 depressive patients and 17 control subjects were used as a database for calculations. SASI values were positive for depressive and negative for control group (P < 0.05). SASI provided the true detection rate of 88% in the depressive and 82% in the control group. The calculated HFD values detected a small (3%) increase with depression (P < 0.05). HFD provided the true detection rate of 94% in the depressive group and 76% in the control group. The rate of correct indication in the both groups was 85% using SASI or HFD. Statistically significant variations were not revealed between hemispheres (P > 0.05). The results indicated that the linear EEG analysis method SASI and the nonlinear HFD method both demonstrated a good sensitivity for detection of characteristic features of depression in a single-channel EEG.

摘要

本研究旨在比较两种脑电图(EEG)分析方法,即频谱不对称指数(SASI)和 Higuchi 的分形维数(HFD),以检测抑郁症。线性 SASI 方法基于评估所选高于和低于 alpha 频段谱最大值的一个通道中两个 EEG 频段的功率平衡。非线性 HFD 方法直接在时域中计算分形维数。17 名抑郁患者和 17 名对照组的静息 EEG 信号被用作计算数据库。SASI 值对抑郁组为正,对对照组为负(P <0.05)。SASI 在抑郁组的真实检出率为 88%,在对照组的真实检出率为 82%。计算出的 HFD 值检测到抑郁时略有增加(3%)(P <0.05)。HFD 在抑郁组的真实检出率为 94%,在对照组的真实检出率为 76%。使用 SASI 或 HFD,两组的正确指示率均为 85%。半球之间未显示出统计学上的显著差异(P >0.05)。结果表明,线性 EEG 分析方法 SASI 和非线性 HFD 方法在单通道 EEG 中均能很好地检测出抑郁症的特征。

https://cdn.ncbi.nlm.nih.gov/pmc/blobs/a180/3819823/37943848775d/CMMM2013-251638.008.jpg
https://cdn.ncbi.nlm.nih.gov/pmc/blobs/a180/3819823/50a8360b0a83/CMMM2013-251638.001.jpg
https://cdn.ncbi.nlm.nih.gov/pmc/blobs/a180/3819823/75d9a1cd7b17/CMMM2013-251638.002.jpg
https://cdn.ncbi.nlm.nih.gov/pmc/blobs/a180/3819823/f003a9683aa2/CMMM2013-251638.003.jpg
https://cdn.ncbi.nlm.nih.gov/pmc/blobs/a180/3819823/8ed3af810431/CMMM2013-251638.004.jpg
https://cdn.ncbi.nlm.nih.gov/pmc/blobs/a180/3819823/660367301c69/CMMM2013-251638.005.jpg
https://cdn.ncbi.nlm.nih.gov/pmc/blobs/a180/3819823/e72b96c3f541/CMMM2013-251638.006.jpg
https://cdn.ncbi.nlm.nih.gov/pmc/blobs/a180/3819823/1cc6baae8ff9/CMMM2013-251638.007.jpg
https://cdn.ncbi.nlm.nih.gov/pmc/blobs/a180/3819823/37943848775d/CMMM2013-251638.008.jpg

相似文献

1
Spectral asymmetry and Higuchi's fractal dimension measures of depression electroencephalogram.抑郁脑电的频谱不对称性和 Higuchi 的分形维数测量。
Comput Math Methods Med. 2013;2013:251638. doi: 10.1155/2013/251638. Epub 2013 Oct 22.
2
Long-term stability of resting state EEG-based linear and nonlinear measures.基于静息态 EEG 的线性和非线性测量的长期稳定性。
Int J Psychophysiol. 2021 Jan;159:83-87. doi: 10.1016/j.ijpsycho.2020.11.013. Epub 2020 Dec 1.
3
Methods for classifying depression in single channel EEG using linear and nonlinear signal analysis.使用线性和非线性信号分析对单通道 EEG 中的抑郁进行分类的方法。
Comput Methods Programs Biomed. 2018 Mar;155:11-17. doi: 10.1016/j.cmpb.2017.11.023. Epub 2017 Nov 28.
4
Electroencephalographic spectral asymmetry index for detection of depression.脑电图频谱不对称指数在抑郁症检测中的应用。
Med Biol Eng Comput. 2009 Dec;47(12):1291-9. doi: 10.1007/s11517-009-0554-9. Epub 2009 Nov 13.
5
Changes in EEG Measures of a Recipient of the mRNA COVID-19 Vaccine - A Case Study.mRNA COVID-19 疫苗接种者脑电图测量指标的变化:病例研究
Annu Int Conf IEEE Eng Med Biol Soc. 2022 Jul;2022:3702-3705. doi: 10.1109/EMBC48229.2022.9871524.
6
Nonlinear analysis of EEG complexity in episode and remission phase of recurrent depression.反复发作性抑郁症发作期和缓解期 EEG 复杂度的非线性分析。
Int J Methods Psychiatr Res. 2020 Jun;29(2):e1816. doi: 10.1002/mpr.1816. Epub 2019 Dec 9.
7
Higuchi's fractal dimension, but not frontal or posterior alpha asymmetry, predicts PID-5 anxiousness more than depressivity.相比抑郁,Higuchi 的分形维数而非额极或枕极α不对称性可以更好地预测 PID-5 的焦虑程度。
Sci Rep. 2019 Dec 23;9(1):19666. doi: 10.1038/s41598-019-56229-w.
8
Fractal Dimension Feature as a Signature of Severity in Disorders of Consciousness: An EEG Study.分形维数特征作为意识障碍严重程度的特征:一项 EEG 研究。
Int J Neural Syst. 2022 Jul;32(7):2250031. doi: 10.1142/S0129065722500319.
9
Application of Higuchi's fractal dimension from basic to clinical neurophysiology: A review.从基础到临床神经生理学的Higuchi分形维数应用:综述
Comput Methods Programs Biomed. 2016 Sep;133:55-70. doi: 10.1016/j.cmpb.2016.05.014. Epub 2016 May 30.
10
Spectral features of EEG in depression.抑郁症患者脑电图的频谱特征。
Biomed Tech (Berl). 2010 Jun;55(3):155-61. doi: 10.1515/BMT.2010.011.

引用本文的文献

1
Exploring the effects of aerobic and resistance exercise on mood-related symptoms and EEG activity.探索有氧运动和抗阻运动对情绪相关症状及脑电图活动的影响。
Front Hum Neurosci. 2025 Mar 28;19:1562702. doi: 10.3389/fnhum.2025.1562702. eCollection 2025.
2
Advances in Understanding Fractals in Affective and Anxiety Disorders.理解情感和焦虑障碍中的分形的进展。
Adv Neurobiol. 2024;36:717-732. doi: 10.1007/978-3-031-47606-8_36.
3
Point of Care Testing (POCT) in Psychopathology Using Fractal Analysis and Hilbert Huang Transform of Electroencephalogram (EEG).

本文引用的文献

1
Electrophysiological signal analysis and visualization using Cloudwave for epilepsy clinical research.使用Cloudwave进行癫痫临床研究的电生理信号分析与可视化
Stud Health Technol Inform. 2013;192:817-21.
2
Validation of a neurofeedback paradigm: manipulating frontal EEG alpha-activity and its impact on mood.一种神经反馈范式的验证:调控额叶脑电图α波活动及其对情绪的影响。
Int J Psychophysiol. 2014 Jul;93(1):116-20. doi: 10.1016/j.ijpsycho.2013.06.010. Epub 2013 Jun 14.
3
Baseline and treatment-emergent EEG biomarkers of antidepressant medication response do not predict response to repetitive transcranial magnetic stimulation.
基于脑电信号的分形分析和希尔伯特-黄变换的精神病理学即时检验(POCT)。
Adv Neurobiol. 2024;36:693-715. doi: 10.1007/978-3-031-47606-8_35.
4
Fractal Analysis of Electrophysiological Signals to Detect and Monitor Depression: What We Know So Far?分形分析电生理信号以检测和监测抑郁症:迄今为止我们了解多少?
Adv Neurobiol. 2024;36:677-692. doi: 10.1007/978-3-031-47606-8_34.
5
Clinical Sensitivity of Fractal Neurodynamics.分形神经动力学的临床灵敏度。
Adv Neurobiol. 2024;36:285-312. doi: 10.1007/978-3-031-47606-8_15.
6
Machine learning approaches and non-linear processing of extracted components in frontal region to predict rTMS treatment response in major depressive disorder.机器学习方法及额叶区域提取成分的非线性处理以预测重度抑郁症的重复经颅磁刺激治疗反应
Front Syst Neurosci. 2023 Mar 9;17:919977. doi: 10.3389/fnsys.2023.919977. eCollection 2023.
7
Identification of normal and depression EEG signals in variational mode decomposition domain.变分模态分解域中正常与抑郁脑电信号的识别
Health Inf Sci Syst. 2022 Sep 1;10(1):24. doi: 10.1007/s13755-022-00187-7. eCollection 2022 Dec.
8
A novel EEG-based major depressive disorder detection framework with two-stage feature selection.基于 EEG 的新型重度抑郁症检测框架,采用两阶段特征选择。
BMC Med Inform Decis Mak. 2022 Aug 6;22(1):209. doi: 10.1186/s12911-022-01956-w.
9
Right Frontal Theta: Is It a Response Biomarker for Ketamine's Therapeutic Action in Anxiety Disorders?右额叶θ波:它是氯胺酮治疗焦虑症的反应生物标志物吗?
Front Neurosci. 2022 Jul 4;16:900105. doi: 10.3389/fnins.2022.900105. eCollection 2022.
10
Progress in Objective Detection of Depression and Online Monitoring of Patients Based on Physiological Complexity.基于生理复杂性的抑郁症客观检测及患者在线监测进展
Front Psychiatry. 2022 Mar 28;13:828773. doi: 10.3389/fpsyt.2022.828773. eCollection 2022.
抗抑郁药物反应的基线和治疗中出现的 EEG 生物标志物不能预测重复经颅磁刺激的反应。
Brain Stimul. 2013 Nov;6(6):929-31. doi: 10.1016/j.brs.2013.05.001. Epub 2013 May 28.
4
EEG alpha power as an intermediate measure between brain-derived neurotrophic factor Val66Met and depression severity in patients with major depressive disorder.脑源性神经营养因子 Val66Met 与重度抑郁症患者大脑电活动阿尔法功率之间的中间测量指标与抑郁严重程度的关系。
J Clin Neurophysiol. 2013 Jun;30(3):261-7. doi: 10.1097/WNP.0b013e3182933d6e.
5
Validity and reliability of electroencephalographic frontal alpha asymmetry and frontal midline theta as biomarkers for depression.脑电图额部α不对称和额中线θ作为抑郁症生物标志物的有效性和可靠性。
Scand J Psychol. 2013 Apr;54(2):118-26. doi: 10.1111/sjop.12022. Epub 2012 Dec 27.
6
Classifying depression patients and normal subjects using machine learning techniques and nonlinear features from EEG signal.使用机器学习技术和 EEG 信号的非线性特征对抑郁症患者和正常受试者进行分类。
Comput Methods Programs Biomed. 2013 Mar;109(3):339-45. doi: 10.1016/j.cmpb.2012.10.008. Epub 2012 Nov 1.
7
Quantitative theory of driven nonlinear brain dynamics.驱动非线性脑动力学的量子理论。
Neuroimage. 2012 Sep;62(3):1947-55. doi: 10.1016/j.neuroimage.2012.05.054. Epub 2012 May 29.
8
Fractality analysis of frontal brain in major depressive disorder.大脑额区的分形分析与重度抑郁症。
Int J Psychophysiol. 2012 Aug;85(2):206-11. doi: 10.1016/j.ijpsycho.2012.05.001. Epub 2012 May 10.
9
Complexity and schizophrenia.复杂性与精神分裂症。
Prog Neuropsychopharmacol Biol Psychiatry. 2013 Aug 1;45:267-76. doi: 10.1016/j.pnpbp.2012.03.015. Epub 2012 Apr 5.
10
Higuchi fractal properties of onset epilepsy electroencephalogram.起始性癫痫脑电图的 Higuchi 分形特性。
Comput Math Methods Med. 2012;2012:461426. doi: 10.1155/2012/461426. Epub 2012 Feb 22.