Singh Nivedita, Choudhury Debjani Roy, Singh Amit Kumar, Kumar Sundeep, Srinivasan Kalyani, Tyagi R K, Singh N K, Singh Rakesh
Division of Genomic Resources, National Bureau of Plant Genetic Resources, New Delhi, Delhi, India.
Germplasm Conservation Division, National Bureau of Plant Genetic Resources, New Delhi, Delhi, India.
PLoS One. 2013 Dec 19;8(12):e84136. doi: 10.1371/journal.pone.0084136. eCollection 2013.
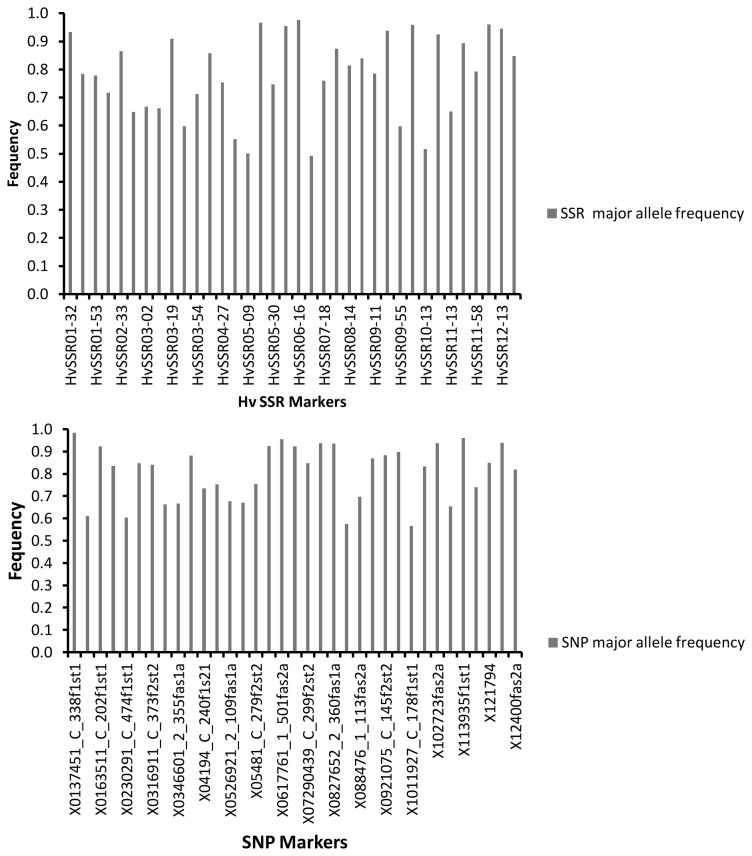
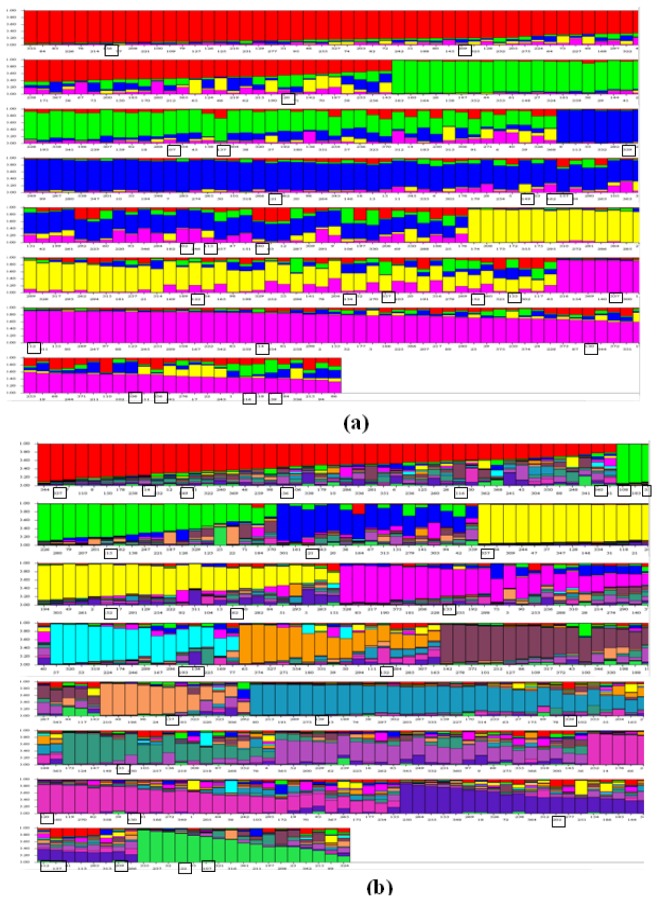
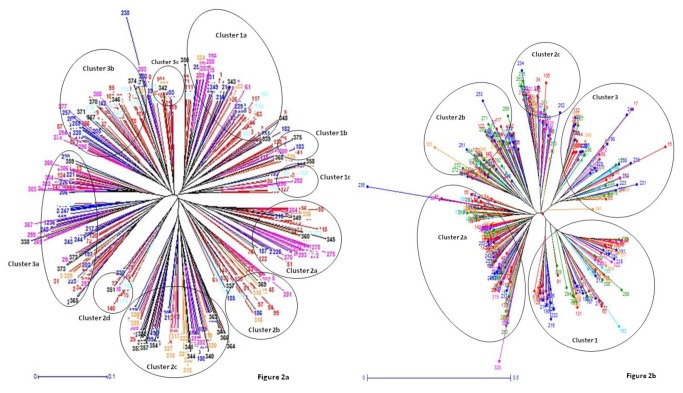
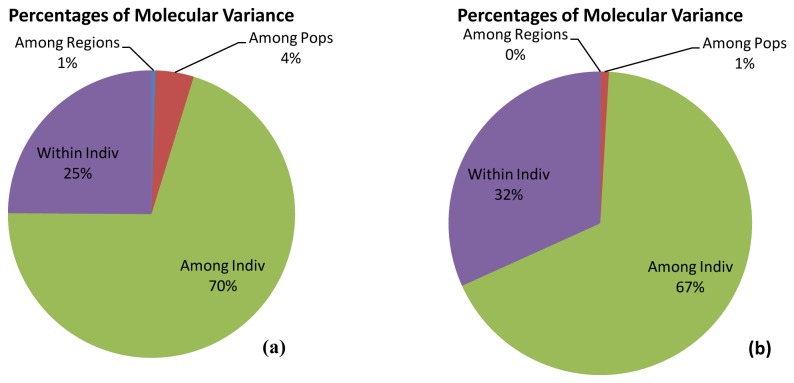
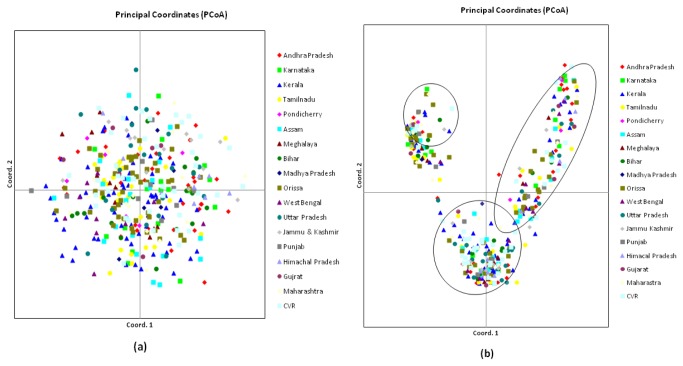
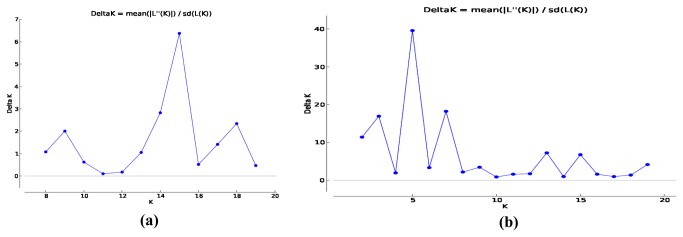
Simple sequence repeat (SSR) and Single Nucleotide Polymorphic (SNP), the two most robust markers for identifying rice varieties were compared for assessment of genetic diversity and population structure. Total 375 varieties of rice from various regions of India archived at the Indian National GeneBank, NBPGR, New Delhi, were analyzed using thirty six genetic markers, each of hypervariable SSR (HvSSR) and SNP which were distributed across 12 rice chromosomes. A total of 80 alleles were amplified with the SSR markers with an average of 2.22 alleles per locus whereas, 72 alleles were amplified with SNP markers. Polymorphic information content (PIC) values for HvSSR ranged from 0.04 to 0.5 with an average of 0.25. In the case of SNP markers, PIC values ranged from 0.03 to 0.37 with an average of 0.23. Genetic relatedness among the varieties was studied; utilizing an unrooted tree all the genotypes were grouped into three major clusters with both SSR and SNP markers. Analysis of molecular variance (AMOVA) indicated that maximum diversity was partitioned between and within individual level but not between populations. Principal coordinate analysis (PCoA) with SSR markers showed that genotypes were uniformly distributed across the two axes with 13.33% of cumulative variation whereas, in case of SNP markers varieties were grouped into three broad groups across two axes with 45.20% of cumulative variation. Population structure were tested using K values from 1 to 20, but there was no clear population structure, therefore Ln(PD) derived Δk was plotted against the K to determine the number of populations. In case of SSR maximum Δk was at K=5 whereas, in case of SNP maximum Δk was found at K=15, suggesting that resolution of population was higher with SNP markers, but SSR were more efficient for diversity analysis.
对用于鉴定水稻品种的两种最可靠的标记——简单序列重复(SSR)和单核苷酸多态性(SNP)进行了比较,以评估遗传多样性和群体结构。使用分布在12条水稻染色体上的36个遗传标记(每个标记分别为高变SSR(HvSSR)和SNP),对保存在新德里印度国家基因库NBPGR的来自印度不同地区的总共375个水稻品种进行了分析。SSR标记共扩增出80个等位基因,每个位点平均有2.22个等位基因,而SNP标记扩增出72个等位基因。HvSSR的多态信息含量(PIC)值在0.04至0.5之间,平均为0.25。对于SNP标记,PIC值在0.03至0.37之间,平均为0.23。研究了品种间的遗传相关性;利用无根树,所有基因型都被分为三个主要簇,使用的标记既有SSR也有SNP。分子方差分析(AMOVA)表明,最大的多样性分布在个体间和个体内,而不是群体间。使用SSR标记的主坐标分析(PCoA)表明,基因型在两个轴上均匀分布,累积变异为13.33%,而对于SNP标记,品种在两个轴上被分为三大组,累积变异为45.20%。使用从1到20的K值测试群体结构,但没有明确的群体结构,因此将推导的Δk的Ln(PD)与K作图以确定群体数量。对于SSR,最大Δk出现在K = 5时,而对于SNP,最大Δk出现在K = 15时,这表明SNP标记对群体的分辨率更高,但SSR在多样性分析方面更有效。