• 文献检索
  • 文档翻译
  • 深度研究
  • 学术资讯
  • Suppr Zotero 插件Zotero 插件
  • 邀请有礼
  • 套餐&价格
  • 历史记录
应用&插件
Suppr Zotero 插件Zotero 插件浏览器插件Mac 客户端Windows 客户端微信小程序
定价
高级版会员购买积分包购买API积分包
服务
文献检索文档翻译深度研究API 文档MCP 服务
关于我们
关于 Suppr公司介绍联系我们用户协议隐私条款
关注我们

Suppr 超能文献

核心技术专利:CN118964589B侵权必究
粤ICP备2023148730 号-1Suppr @ 2026

文献检索

告别复杂PubMed语法,用中文像聊天一样搜索,搜遍4000万医学文献。AI智能推荐,让科研检索更轻松。

立即免费搜索

文件翻译

保留排版,准确专业,支持PDF/Word/PPT等文件格式,支持 12+语言互译。

免费翻译文档

深度研究

AI帮你快速写综述,25分钟生成高质量综述,智能提取关键信息,辅助科研写作。

立即免费体验

利用ALOS/PALSAR绘制的东南亚50米森林覆盖图及其在森林破碎化评估中的应用。

A 50-m forest cover map in Southeast Asia from ALOS/PALSAR and its application on forest fragmentation assessment.

作者信息

Dong Jinwei, Xiao Xiangming, Sheldon Sage, Biradar Chandrashekhar, Zhang Geli, Duong Nguyen Dinh, Hazarika Manzul, Wikantika Ketut, Takeuhci Wataru, Moore Berrien

机构信息

Department of Microbiology and Plant Biology, and Center for Spatial Analysis, University of Oklahoma, Norman, Oklahoma, United States of America.

International Center for Agricultural Research in Dry Areas, Amman, Jordan.

出版信息

PLoS One. 2014 Jan 22;9(1):e85801. doi: 10.1371/journal.pone.0085801. eCollection 2014.

DOI:10.1371/journal.pone.0085801
PMID:24465714
原文链接:https://pmc.ncbi.nlm.nih.gov/articles/PMC3899076/
Abstract

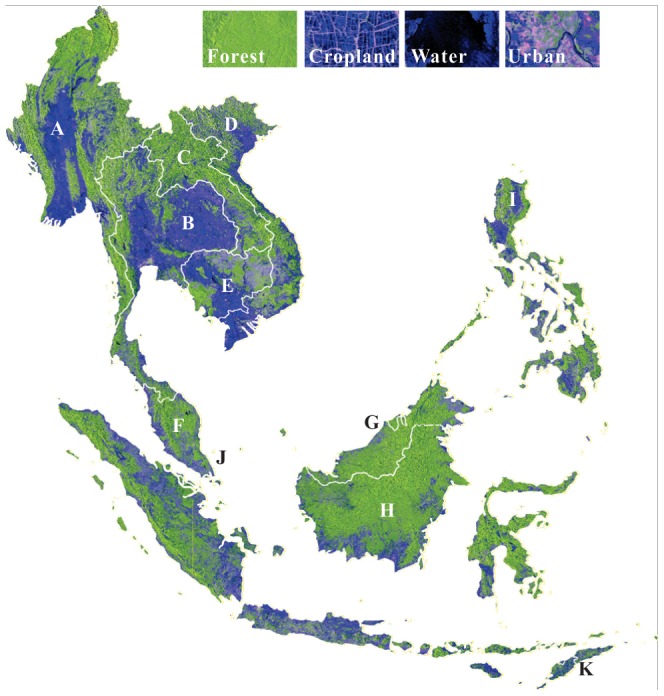
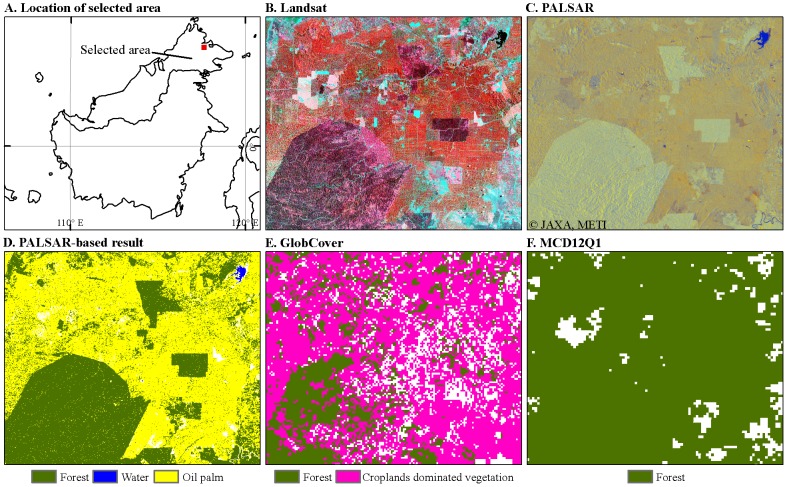
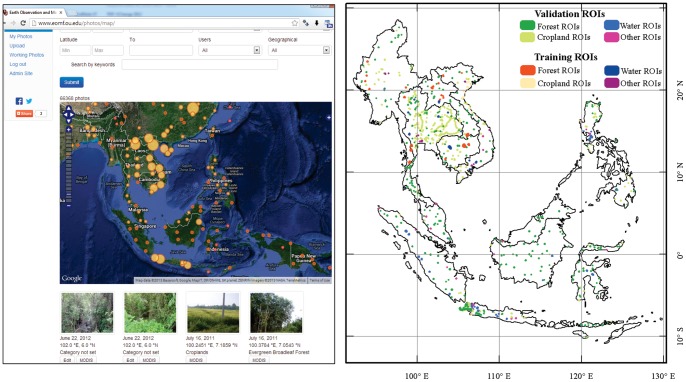
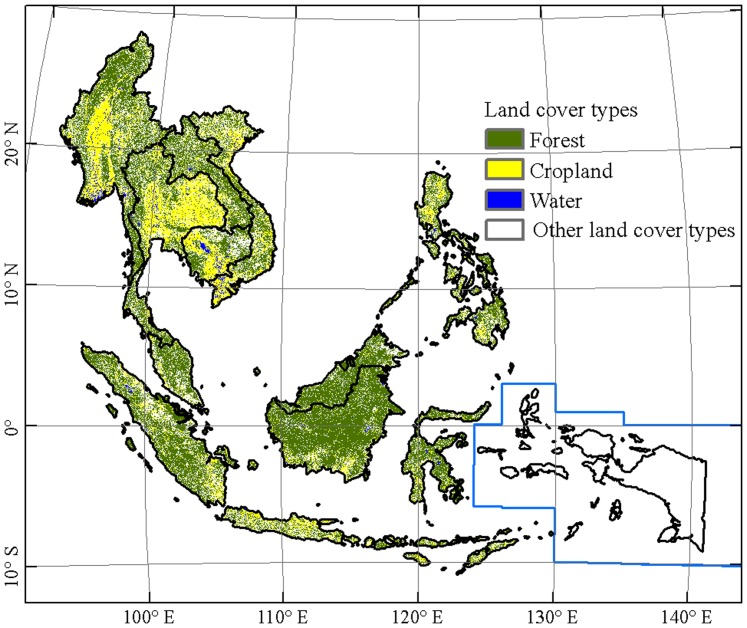
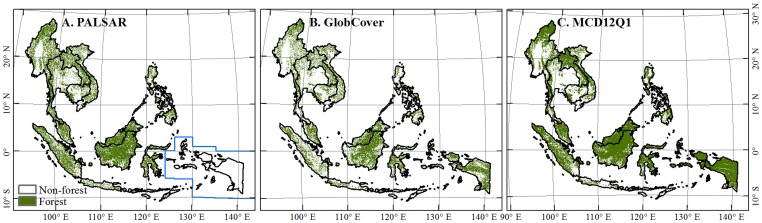
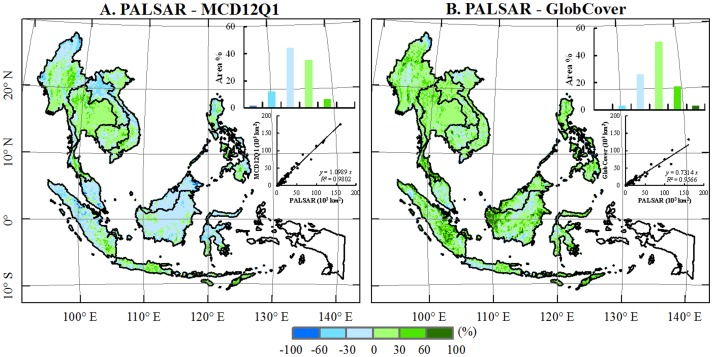
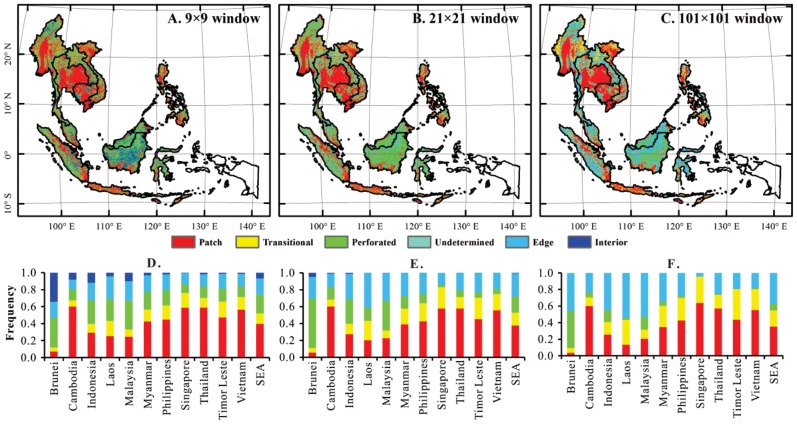
Southeast Asia experienced higher rates of deforestation than other continents in the 1990s and still was a hotspot of forest change in the 2000s. Biodiversity conservation planning and accurate estimation of forest carbon fluxes and pools need more accurate information about forest area, spatial distribution and fragmentation. However, the recent forest maps of Southeast Asia were generated from optical images at spatial resolutions of several hundreds of meters, and they do not capture well the exceptionally complex and dynamic environments in Southeast Asia. The forest area estimates from those maps vary substantially, ranging from 1.73×10(6) km(2) (GlobCover) to 2.69×10(6) km(2) (MCD12Q1) in 2009; and their uncertainty is constrained by frequent cloud cover and coarse spatial resolution. Recently, cloud-free imagery from the Phased Array Type L-band Synthetic Aperture Radar (PALSAR) onboard the Advanced Land Observing Satellite (ALOS) became available. We used the PALSAR 50-m orthorectified mosaic imagery in 2009 to generate a forest cover map of Southeast Asia at 50-m spatial resolution. The validation, using ground-reference data collected from the Geo-Referenced Field Photo Library and high-resolution images in Google Earth, showed that our forest map has a reasonably high accuracy (producer's accuracy 86% and user's accuracy 93%). The PALSAR-based forest area estimates in 2009 are significantly correlated with those from GlobCover and MCD12Q1 at national and subnational scales but differ in some regions at the pixel scale due to different spatial resolutions, forest definitions, and algorithms. The resultant 50-m forest map was used to quantify forest fragmentation and it revealed substantial details of forest fragmentation. This new 50-m map of tropical forests could serve as a baseline map for forest resource inventory, deforestation monitoring, reducing emissions from deforestation and forest degradation (REDD+) implementation, and biodiversity.

摘要

20世纪90年代,东南亚的森林砍伐率高于其他各大洲,到了21世纪,它仍是森林变化的热点地区。生物多样性保护规划以及对森林碳通量和碳库的准确估算需要有关森林面积、空间分布和破碎化的更精确信息。然而,东南亚最近的森林地图是根据空间分辨率为数百米的光学图像生成的,无法很好地反映东南亚异常复杂和动态的环境。这些地图估算的森林面积差异很大,2009年从173万平方千米(全球土地覆盖图)到269万平方千米(MCD12Q1)不等;其不确定性受到频繁云层覆盖和粗略空间分辨率的限制。最近,搭载在先进陆地观测卫星(ALOS)上的相控阵L波段合成孔径雷达(PALSAR)获取了无云图像。我们利用2009年PALSAR的50米正射校正镶嵌图像生成了东南亚50米空间分辨率的森林覆盖图。通过使用从地理参考野外照片库收集的地面参考数据和谷歌地球中的高分辨率图像进行验证,结果表明我们的森林地图具有相当高的准确性(生产者精度为86%,用户精度为93%)。2009年基于PALSAR的森林面积估算在国家和次国家尺度上与全球土地覆盖图和MCD12Q1的估算显著相关,但由于空间分辨率、森林定义和算法不同,在像素尺度上的某些区域存在差异。由此生成的50米森林地图被用于量化森林破碎化,并揭示了森林破碎化的大量细节。这张新的50米热带森林地图可作为森林资源清查、森林砍伐监测、减少毁林和森林退化所致排放量(REDD+)实施以及生物多样性的基础地图。

https://cdn.ncbi.nlm.nih.gov/pmc/blobs/4454/3899076/ca5a610d6a10/pone.0085801.g007.jpg
https://cdn.ncbi.nlm.nih.gov/pmc/blobs/4454/3899076/5156e8253738/pone.0085801.g001.jpg
https://cdn.ncbi.nlm.nih.gov/pmc/blobs/4454/3899076/91b99bc3663c/pone.0085801.g002.jpg
https://cdn.ncbi.nlm.nih.gov/pmc/blobs/4454/3899076/15d5b6903dbe/pone.0085801.g003.jpg
https://cdn.ncbi.nlm.nih.gov/pmc/blobs/4454/3899076/6b57abd62326/pone.0085801.g004.jpg
https://cdn.ncbi.nlm.nih.gov/pmc/blobs/4454/3899076/7013aa728040/pone.0085801.g005.jpg
https://cdn.ncbi.nlm.nih.gov/pmc/blobs/4454/3899076/5c4ea7603c02/pone.0085801.g006.jpg
https://cdn.ncbi.nlm.nih.gov/pmc/blobs/4454/3899076/ca5a610d6a10/pone.0085801.g007.jpg

相似文献

1
A 50-m forest cover map in Southeast Asia from ALOS/PALSAR and its application on forest fragmentation assessment.利用ALOS/PALSAR绘制的东南亚50米森林覆盖图及其在森林破碎化评估中的应用。
PLoS One. 2014 Jan 22;9(1):e85801. doi: 10.1371/journal.pone.0085801. eCollection 2014.
2
Mapping forests in monsoon Asia with ALOS PALSAR 50-m mosaic images and MODIS imagery in 2010.2010年利用先进陆地观测卫星(ALOS)相控阵L波段合成孔径雷达(PALSAR)50米镶嵌图像和中分辨率成像光谱仪(MODIS)影像绘制亚洲季风区森林图。
Sci Rep. 2016 Feb 11;6:20880. doi: 10.1038/srep20880.
3
Determination of tropical deforestation rates and related carbon losses from 1990 to 2010.1990年至2010年热带森林砍伐率及相关碳损失的测定。
Glob Chang Biol. 2014 Aug;20(8):2540-54. doi: 10.1111/gcb.12605. Epub 2014 May 30.
4
PALSAR 50 m mosaic data based national level biomass estimation in Cambodia for implementation of REDD+ mechanism.基于 PALSAR 50 米镶嵌数据的柬埔寨国家级生物量估算,以实施 REDD+ 机制。
PLoS One. 2013 Oct 7;8(10):e74807. doi: 10.1371/journal.pone.0074807. eCollection 2013.
5
Benchmark map of forest carbon stocks in tropical regions across three continents.三大洲热带地区森林碳储量基准图。
Proc Natl Acad Sci U S A. 2011 Jun 14;108(24):9899-904. doi: 10.1073/pnas.1019576108. Epub 2011 May 31.
6
Improving aboveground biomass maps of tropical dry forests by integrating LiDAR, ALOS PALSAR, climate and field data.通过整合激光雷达、先进陆地观测卫星相控阵L波段合成孔径雷达、气候和实地数据改进热带干燥森林地上生物量地图。
Carbon Balance Manag. 2020 Jul 29;15(1):15. doi: 10.1186/s13021-020-00151-6.
7
Forest cover of insular Southeast Asia mapped from recent satellite images of coarse spatial resolution.根据近期低空间分辨率卫星图像绘制的东南亚岛屿森林覆盖图。
Ambio. 2003 Nov;32(7):469-75. doi: 10.1579/0044-7447-32.7.469.
8
Time-series maps of aboveground biomass in dipterocarps forests of Malaysia from PALSAR and PALSAR-2 polarimetric data.利用PALSAR和PALSAR-2极化数据绘制的马来西亚龙脑香科森林地上生物量的时间序列地图。
Carbon Balance Manag. 2018 Oct 19;13(1):19. doi: 10.1186/s13021-018-0108-2.
9
Natural forest biomass estimation based on plantation information using PALSAR data.利用合成孔径雷达(PALSAR)数据基于人工林信息进行天然森林生物量估计。
PLoS One. 2014 Jan 21;9(1):e86121. doi: 10.1371/journal.pone.0086121. eCollection 2014.
10
A biomass map of the Brazilian Amazon from multisource remote sensing.巴西亚马逊地区多源遥感生物质图
Sci Data. 2023 Sep 30;10(1):668. doi: 10.1038/s41597-023-02575-4.

引用本文的文献

1
Oil palm expansion increases the vectorial capacity of dengue vectors in Malaysian Borneo.油棕种植园的扩张增加了登革热媒介在马来西亚婆罗洲的传播能力。
PLoS Negl Trop Dis. 2022 Mar 16;16(3):e0009525. doi: 10.1371/journal.pntd.0009525. eCollection 2022 Mar.
2
Large net forest loss in Cambodia's Tonle Sap Lake protected areas during 1992-2019.1992-2019 年期间柬埔寨洞里萨湖保护区的大规模森林净损失。
Ambio. 2022 Aug;51(8):1889-1903. doi: 10.1007/s13280-022-01704-4. Epub 2022 Feb 8.
3
Evaluating remote sensing datasets and machine learning algorithms for mapping plantations and successional forests in Phnom Kulen National Park of Cambodia.

本文引用的文献

1
Horizontal Positional Accuracy of Google Earth's High-Resolution Imagery Archive.谷歌地球高分辨率影像存档的水平定位精度
Sensors (Basel). 2008 Dec 8;8(12):7973-7981. doi: 10.3390/s8127973.
2
Reconciling forest conservation and logging in Indonesian Borneo.在印度尼西亚婆罗洲协调森林保护和伐木。
PLoS One. 2013 Aug 14;8(8):e69887. doi: 10.1371/journal.pone.0069887. eCollection 2013.
3
Decline of forest interior conditions in the conterminous United States.美国本土森林内部条件的衰退。
评估用于绘制柬埔寨豆蔻山国家公园种植园和次生林地图的遥感数据集及机器学习算法。
PeerJ. 2019 Oct 22;7:e7841. doi: 10.7717/peerj.7841. eCollection 2019.
4
Using low-cost drones to map malaria vector habitats.使用低成本无人机绘制疟疾媒介栖息地地图。
Parasit Vectors. 2017 Jan 14;10(1):29. doi: 10.1186/s13071-017-1973-3.
5
Mapping paddy rice planting area in rice-wetland coexistent areas through analysis of Landsat 8 OLI and MODIS images.通过分析陆地卫星8号OLI和中分辨率成像光谱仪(MODIS)图像绘制水稻-湿地共存区域的水稻种植面积
Int J Appl Earth Obs Geoinf. 2016 Apr;46:1-12. doi: 10.1016/j.jag.2015.11.001. Epub 2015 Nov 28.
6
Remotely Sensed Data Informs Red List Evaluations and Conservation Priorities in Southeast Asia.遥感数据为东南亚的红色名录评估和保护重点提供信息。
PLoS One. 2016 Aug 3;11(8):e0160566. doi: 10.1371/journal.pone.0160566. eCollection 2016.
7
Mapping forests in monsoon Asia with ALOS PALSAR 50-m mosaic images and MODIS imagery in 2010.2010年利用先进陆地观测卫星(ALOS)相控阵L波段合成孔径雷达(PALSAR)50米镶嵌图像和中分辨率成像光谱仪(MODIS)影像绘制亚洲季风区森林图。
Sci Rep. 2016 Feb 11;6:20880. doi: 10.1038/srep20880.
8
Forest Cover Estimation in Ireland Using Radar Remote Sensing: A Comparative Analysis of Forest Cover Assessment Methodologies.利用雷达遥感技术进行爱尔兰森林覆盖估计:森林覆盖评估方法的比较分析
PLoS One. 2015 Aug 11;10(8):e0133583. doi: 10.1371/journal.pone.0133583. eCollection 2015.
9
Annual Carbon Emissions from Deforestation in the Amazon Basin between 2000 and 2010.2000年至2010年期间亚马逊盆地森林砍伐产生的年度碳排放。
PLoS One. 2015 May 7;10(5):e0126754. doi: 10.1371/journal.pone.0126754. eCollection 2015.
Sci Rep. 2012;2:653. doi: 10.1038/srep00653. Epub 2012 Sep 13.
4
Baseline map of carbon emissions from deforestation in tropical regions.热带地区森林砍伐导致的碳排放基线图。
Science. 2012 Jun 22;336(6088):1573-6. doi: 10.1126/science.1217962.
5
Remotely sensed evidence of tropical peatland conversion to oil palm.遥感证据表明热带泥炭地已转换为油棕榈种植园。
Proc Natl Acad Sci U S A. 2011 Mar 22;108(12):5127-32. doi: 10.1073/pnas.1018776108. Epub 2011 Mar 7.
6
Tropical forests were the primary sources of new agricultural land in the 1980s and 1990s.20 世纪 80 年代和 90 年代,热带森林是新农业用地的主要来源。
Proc Natl Acad Sci U S A. 2010 Sep 21;107(38):16732-7. doi: 10.1073/pnas.0910275107. Epub 2010 Aug 31.
7
Comparing forest fragmentation and its drivers in China and the USA with Globcover v2.2.比较中国和美国的森林破碎化及其驱动因素与 Globcover v2.2。
J Environ Manage. 2010 Dec;91(12):2572-80. doi: 10.1016/j.jenvman.2010.07.010. Epub 2010 Aug 10.
8
Quantification of global gross forest cover loss.全球森林总覆盖面积减少的量化。
Proc Natl Acad Sci U S A. 2010 May 11;107(19):8650-5. doi: 10.1073/pnas.0912668107. Epub 2010 Apr 26.
9
Forest transition in Vietnam and displacement of deforestation abroad.越南的森林转型与国外森林砍伐的转移
Proc Natl Acad Sci U S A. 2009 Sep 22;106(38):16139-44. doi: 10.1073/pnas.0904942106. Epub 2009 Sep 4.
10
Humid tropical forest clearing from 2000 to 2005 quantified by using multitemporal and multiresolution remotely sensed data.利用多时相和多分辨率遥感数据对2000年至2005年潮湿热带森林砍伐情况进行量化。
Proc Natl Acad Sci U S A. 2008 Jul 8;105(27):9439-44. doi: 10.1073/pnas.0804042105. Epub 2008 Jun 30.