Hammad Seddik, Hoehme Stefan, Friebel Adrian, von Recklinghausen Iris, Othman Amnah, Begher-Tibbe Brigitte, Reif Raymond, Godoy Patricio, Johann Tim, Vartak Amruta, Golka Klaus, Bucur Petru O, Vibert Eric, Marchan Rosemarie, Christ Bruno, Dooley Steven, Meyer Christoph, Ilkavets Iryna, Dahmen Uta, Dirsch Olaf, Böttger Jan, Gebhardt Rolf, Drasdo Dirk, Hengstler Jan G
Leibniz Research Centre for Working Environment and Human Factors (IfADo), TU Dortmund University, Dortmund, Germany,
Arch Toxicol. 2014 May;88(5):1161-83. doi: 10.1007/s00204-014-1243-5. Epub 2014 Apr 19.
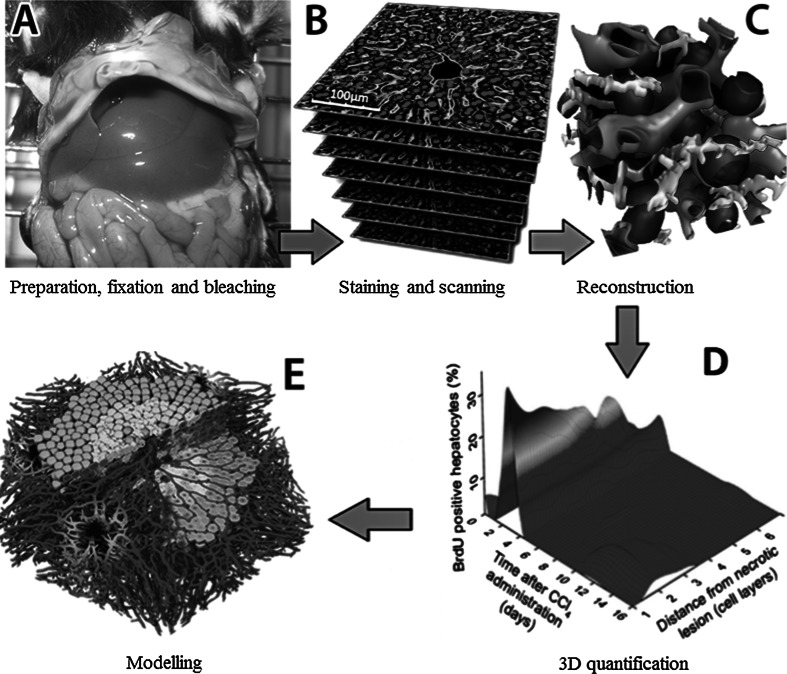
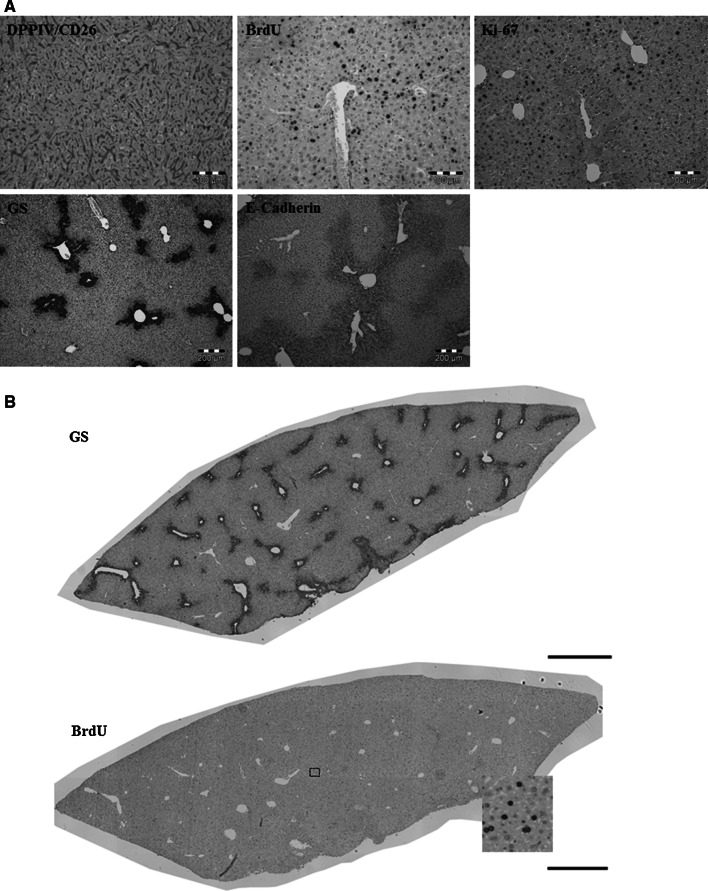
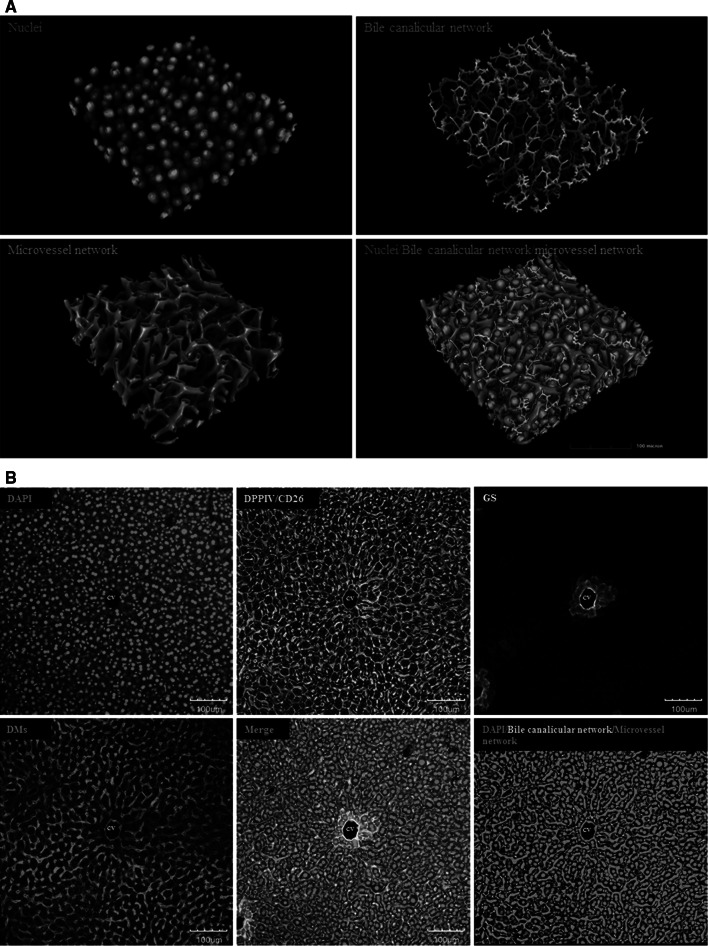
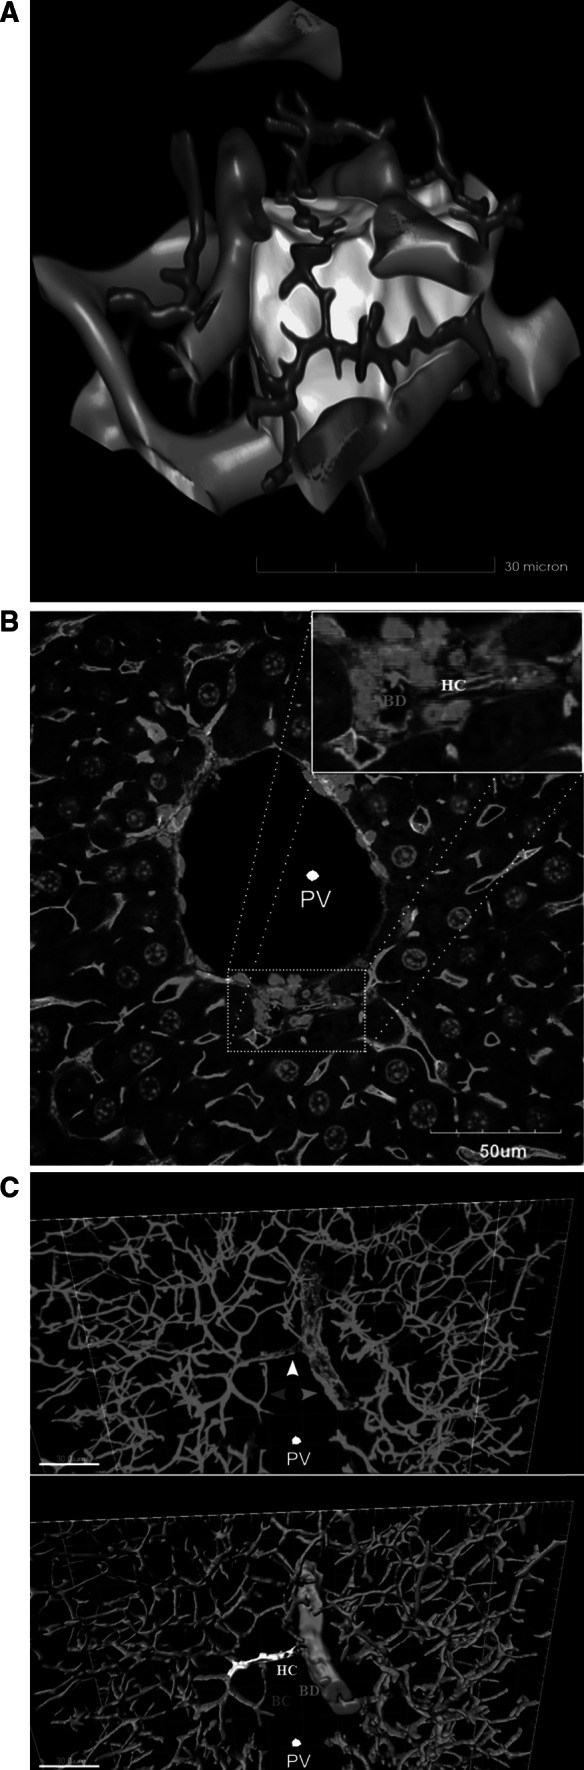
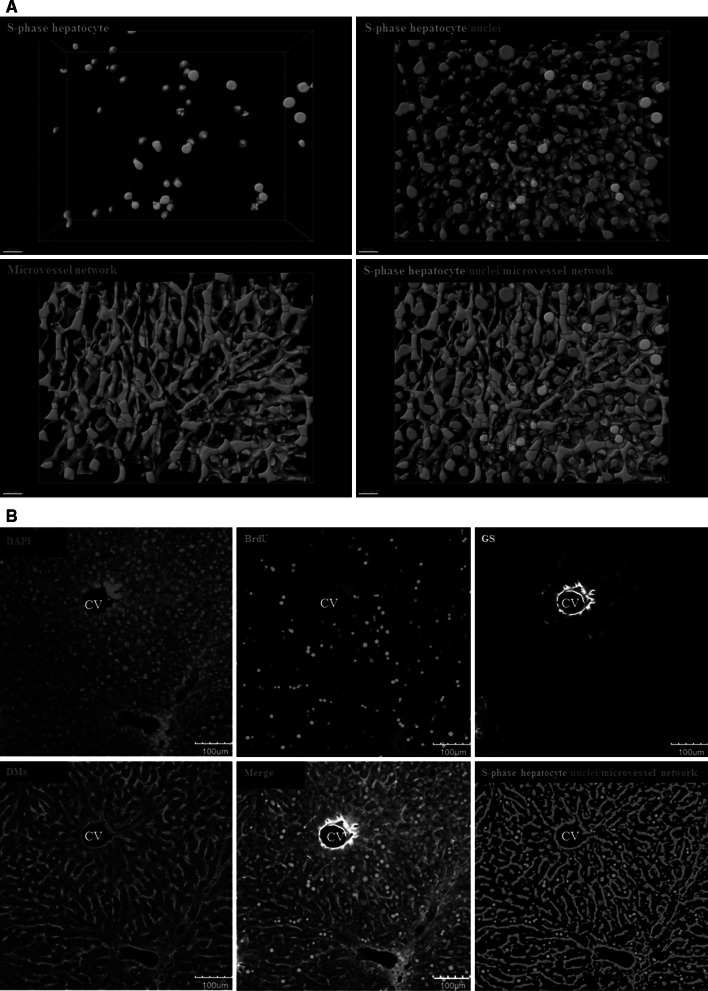
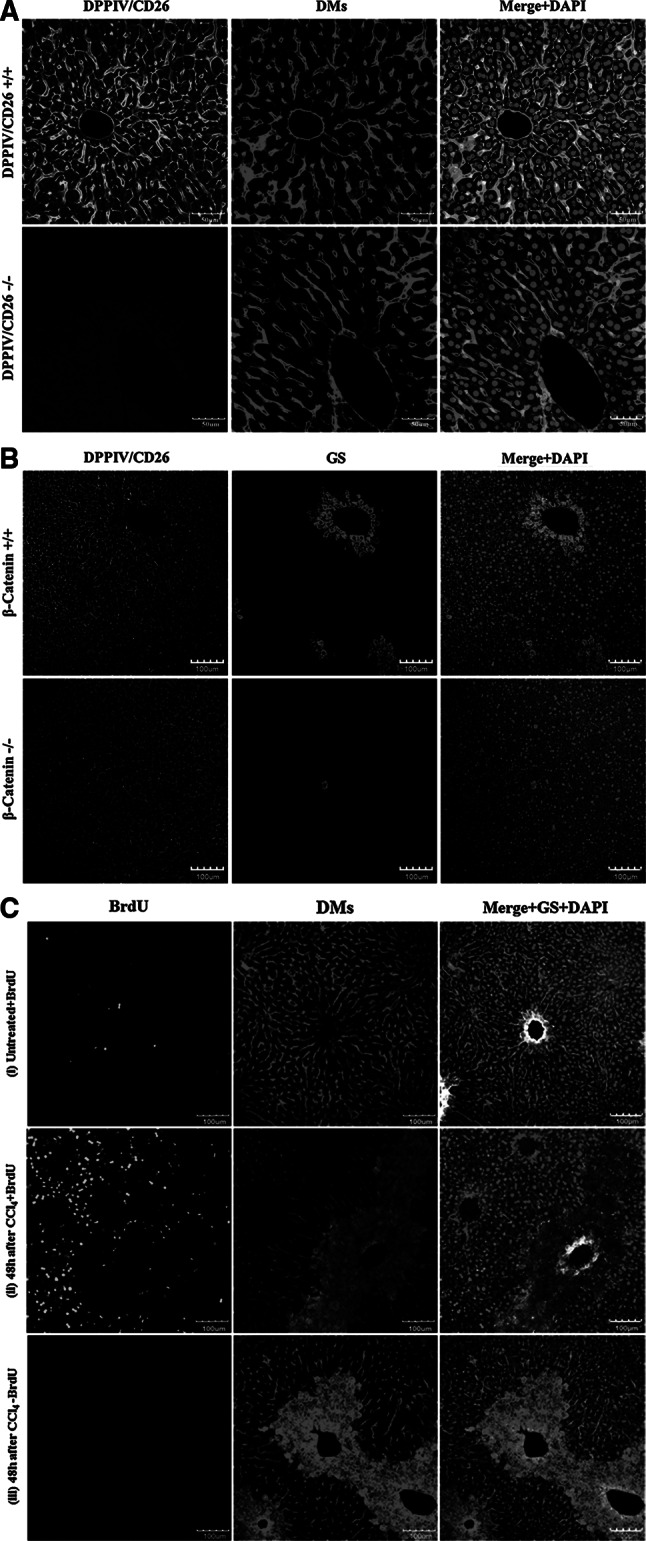
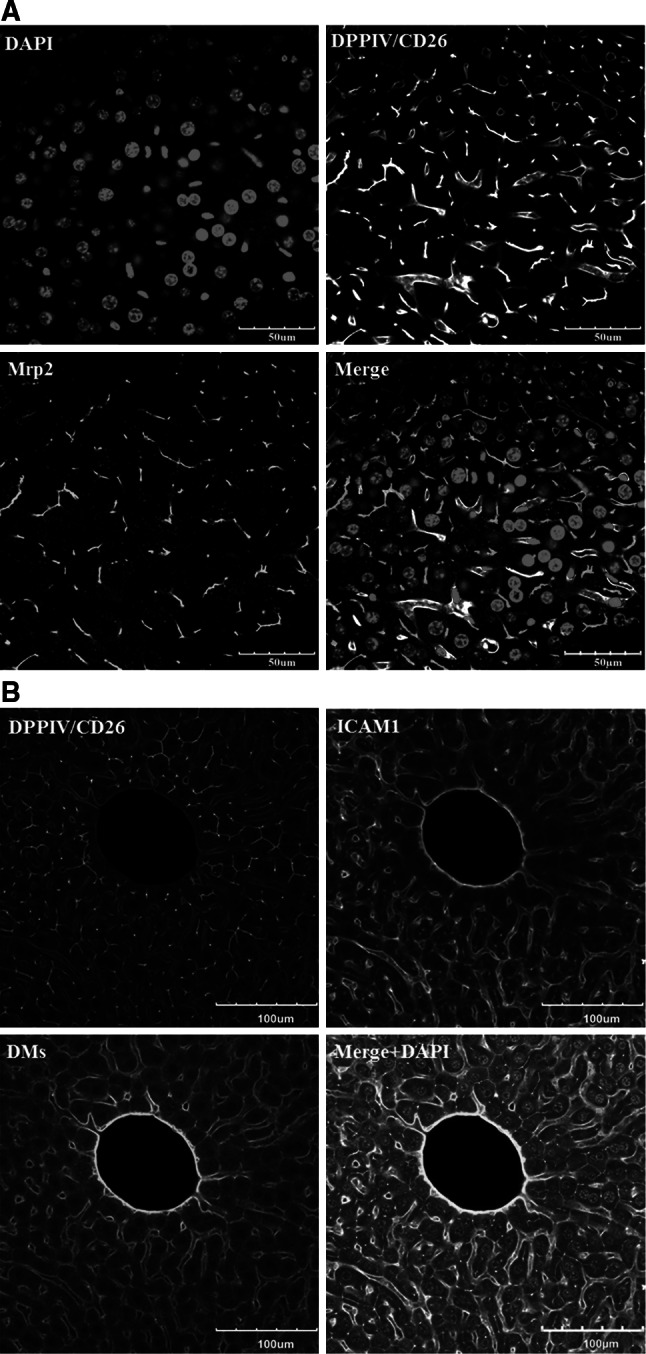
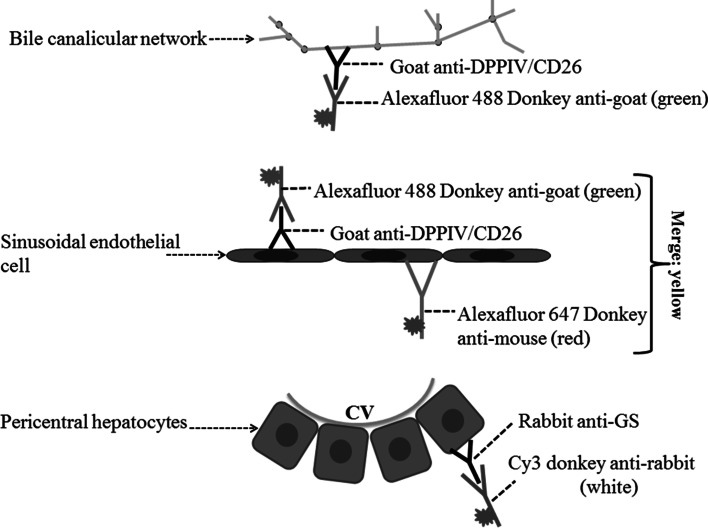
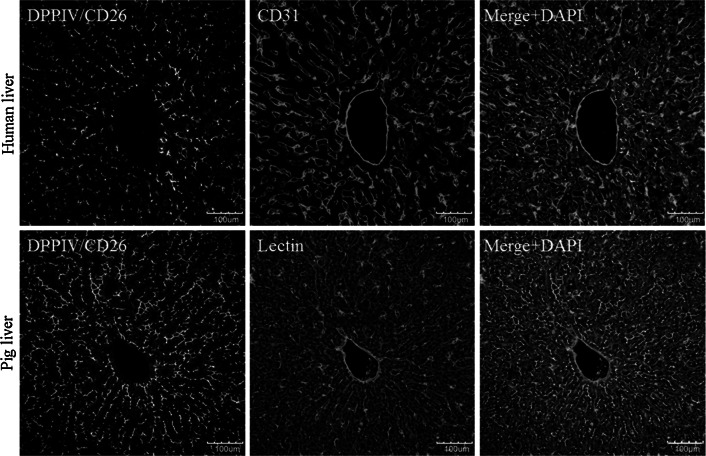
Histological alterations often constitute a fingerprint of toxicity and diseases. The extent to which these alterations are cause or consequence of compromised organ function, and the underlying mechanisms involved is a matter of intensive research. In particular, liver disease is often associated with altered tissue microarchitecture, which in turn may compromise perfusion and functionality. Research in this field requires the development and orchestration of new techniques into standardized processing pipelines that can be used to reproducibly quantify tissue architecture. Major bottlenecks include the lack of robust staining, and adequate reconstruction and quantification techniques. To bridge this gap, we established protocols employing specific antibody combinations for immunostaining, confocal imaging, three-dimensional reconstruction of approximately 100-μm-thick tissue blocks and quantification of key architectural features. We describe a standard procedure termed 'liver architectural staining' for the simultaneous visualization of bile canaliculi, sinusoidal endothelial cells, glutamine synthetase (GS) for the identification of central veins, and DAPI as a nuclear marker. Additionally, we present a second standard procedure entitled 'S-phase staining', where S-phase-positive and S-phase-negative nuclei (stained with BrdU and DAPI, respectively), sinusoidal endothelial cells and GS are stained. The techniques include three-dimensional reconstruction of the sinusoidal and bile canalicular networks from the same tissue block, and robust capture of position, size and shape of individual hepatocytes, as well as entire lobules from the same tissue specimen. In addition to the protocols, we have also established image analysis software that allows relational and hierarchical quantifications of different liver substructures (e.g. cells and vascular branches) and events (e.g. cell proliferation and death). Typical results acquired for routinely quantified parameters in adult mice (C57Bl6/N) include the hepatocyte volume (5,128.3 ± 837.8 μm(3)) and the fraction of the hepatocyte surface in contact with the neighbouring hepatocytes (67.4 ± 6.7 %), sinusoids (22.1 ± 4.8 %) and bile canaliculi (9.9 ± 3.8 %). Parameters of the sinusoidal network that we also routinely quantify include the radius of the sinusoids (4.8 ± 2.25 μm), the branching angle (32.5 ± 11.2°), the length of intersection branches (23.93 ± 5.9 μm), the number of intersection nodes per mm(3) (120.3 × 10³ ± 42.1 × 10(3)), the average length of sinusoidal vessel per mm(3) (5.4 × 10(3) ± 1.4 × 10(3)mm) and the percentage of vessel volume in relation to the whole liver volume (15.3 ± 3.9) (mean ± standard deviation). Moreover, the provided parameters of the bile canalicular network are: length of the first-order branches (7.5 ± 0.6 μm), length of the second-order branches (10.9 ± 1.8 μm), length of the dead-end branches (5.9 ± 0.7 μm), the number of intersection nodes per mm(3) (819.1 × 10(3) ± 180.7 × 10(3)), the number of dead-end branches per mm(3) (409.9 × 10(3) ± 95.6 × 10(3)), the length of the bile canalicular network per mm(3) (9.4 × 10(3) ± 0.7 × 10(3) mm) and the percentage of the bile canalicular volume with respect to the total liver volume (3.4 ± 0.005). A particular strength of our technique is that quantitative parameters of hepatocytes and bile canalicular as well as sinusoidal networks can be extracted from the same tissue block. Reconstructions and quantifications performed as described in the current protocols can be used for quantitative mathematical modelling of the underlying mechanisms. Furthermore, protocols are presented for both human and pig livers. The technique is also applicable for both vibratome blocks and conventional paraffin slices.
组织学改变常常构成毒性和疾病的特征。这些改变在多大程度上是器官功能受损的原因或结果,以及其中涉及的潜在机制,是深入研究的课题。特别是,肝脏疾病常与组织微结构改变相关,而这反过来又可能损害灌注和功能。该领域的研究需要开发新技术并将其整合到标准化处理流程中,以便可重复地量化组织结构。主要瓶颈包括缺乏可靠的染色方法以及适当的重建和量化技术。为了弥补这一差距,我们建立了方案,采用特定抗体组合进行免疫染色、共聚焦成像、对约100微米厚的组织块进行三维重建以及对关键结构特征进行量化。我们描述了一种称为“肝脏结构染色”的标准程序,用于同时可视化胆小管、窦状内皮细胞、用于识别中央静脉的谷氨酰胺合成酶(GS)以及作为核标记的DAPI。此外,我们还介绍了第二种标准程序,名为“S期染色”,其中S期阳性和S期阴性细胞核(分别用BrdU和DAPI染色)、窦状内皮细胞和GS被染色。这些技术包括从同一组织块对窦状和胆小管网络进行三维重建,以及对单个肝细胞以及同一组织标本中整个肝小叶的位置、大小和形状进行可靠捕获。除了这些方案,我们还建立了图像分析软件,可对不同肝脏亚结构(如细胞和血管分支)以及事件(如细胞增殖和死亡)进行关联和分层量化。成年小鼠(C57Bl6/N)常规量化参数的典型结果包括肝细胞体积(5,128.3 ± 837.8立方微米)、与相邻肝细胞接触的肝细胞表面积比例(67.4 ± ± 6.7%)、窦状隙(22.1 ± 4.8%)和胆小管(9.9 ± 3.8%)。我们常规量化的窦状网络参数还包括窦状隙半径(4.8 ± 2.25微米)、分支角度(32.5 ± 11.2°)、交叉分支长度(23.93 ± 5.9微米)、每立方毫米交叉节点数(120.3×10³ ± 42.1×10³)、每立方毫米窦状血管平均长度(5.4×10³ ± 1.4×10³毫米)以及血管体积相对于整个肝脏体积的百分比(15.3 ± 3.9)(平均值 ± 标准差)。此外,提供的胆小管网络参数为:一级分支长度(7.5 ± 0.6微米)、二级分支长度(10.9 ± 1.8微米)、盲端分支长度(5.9 ± 0.7微米)、每立方毫米交叉节点数(819.1×10³ ± 180.7×10³)、每立方毫米盲端分支数(409.9×10³ ± 95.6×10³)、每立方毫米胆小管网络长度(9.4×10³ ± 0.7×10³毫米)以及胆小管体积相对于肝脏总体积的百分比(3.4 ± 0.005)。我们技术的一个特别优势在于,可以从同一组织块中提取肝细胞、胆小管以及窦状网络的定量参数。按照当前方案进行的重建和量化可用于对潜在机制进行定量数学建模。此外,还给出了针对人类和猪肝脏的方案。该技术也适用于振动切片块和传统石蜡切片。