• 文献检索
  • 文档翻译
  • 深度研究
  • 学术资讯
  • Suppr Zotero 插件Zotero 插件
  • 邀请有礼
  • 套餐&价格
  • 历史记录
应用&插件
Suppr Zotero 插件Zotero 插件浏览器插件Mac 客户端Windows 客户端微信小程序
定价
高级版会员购买积分包购买API积分包
服务
文献检索文档翻译深度研究API 文档MCP 服务
关于我们
关于 Suppr公司介绍联系我们用户协议隐私条款
关注我们

Suppr 超能文献

核心技术专利:CN118964589B侵权必究
粤ICP备2023148730 号-1Suppr @ 2026

文献检索

告别复杂PubMed语法,用中文像聊天一样搜索,搜遍4000万医学文献。AI智能推荐,让科研检索更轻松。

立即免费搜索

文件翻译

保留排版,准确专业,支持PDF/Word/PPT等文件格式,支持 12+语言互译。

免费翻译文档

深度研究

AI帮你快速写综述,25分钟生成高质量综述,智能提取关键信息,辅助科研写作。

立即免费体验

用于多序列比对比较分析的序列多样性图。

Sequence Diversity Diagram for comparative analysis of multiple sequence alignments.

作者信息

Sakai Ryo, Aerts Jan

机构信息

Department of Electrical Engineering (ESAT) STADIUS Center for Dynamical Systems, Signal Processing and Data Analytics, KU Leuven, Kasteelpark Arenberg 10, 3001 Leuven, Belgium ; iMinds Medical IT, Leuven, Belgium.

出版信息

BMC Proc. 2014 Aug 28;8(Suppl 2 Proceedings of the 3rd Annual Symposium on Biologica):S9. doi: 10.1186/1753-6561-8-S2-S9. eCollection 2014.

DOI:10.1186/1753-6561-8-S2-S9
PMID:25237396
原文链接:https://pmc.ncbi.nlm.nih.gov/articles/PMC4155614/
Abstract

BACKGROUND

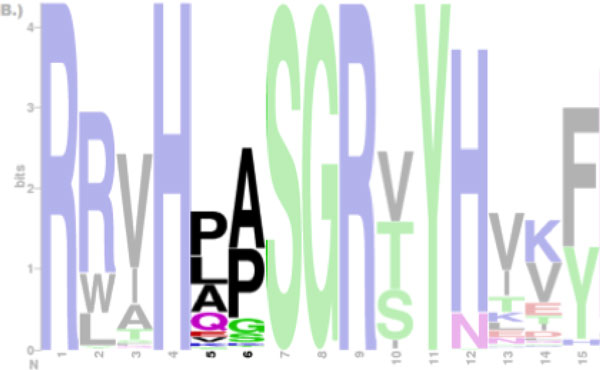
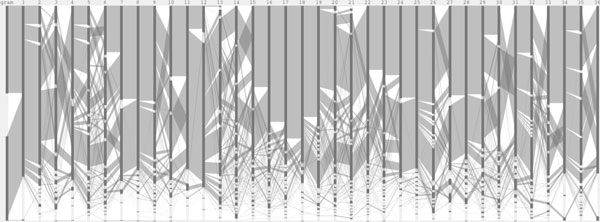
The sequence logo is a graphical representation of a set of aligned sequences, commonly used to depict conservation of amino acid or nucleotide sequences. Although it effectively communicates the amount of information present at every position, this visual representation falls short when the domain task is to compare between two or more sets of aligned sequences. We present a new visual presentation called a Sequence Diversity Diagram and validate our design choices with a case study.

METHODS

Our software was developed using the open-source program called Processing. It loads multiple sequence alignment FASTA files and a configuration file, which can be modified as needed to change the visualization.

RESULTS

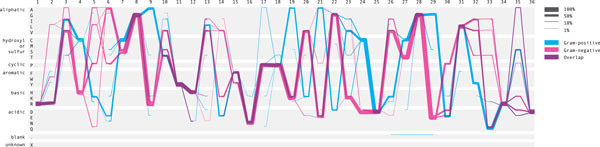
The redesigned figure improves on the visual comparison of two or more sets, and it additionally encodes information on sequential position conservation. In our case study of the adenylate kinase lid domain, the Sequence Diversity Diagram reveals unexpected patterns and new insights, for example the identification of subgroups within the protein subfamily. Our future work will integrate this visual encoding into interactive visualization tools to support higher level data exploration tasks.

摘要

背景

序列图是一组比对序列的图形表示,常用于描绘氨基酸或核苷酸序列的保守性。尽管它能有效地传达每个位置的信息量,但当任务是比较两组或更多组比对序列时,这种可视化表示就显得不足。我们提出了一种名为序列多样性图的新可视化表示,并通过一个案例研究验证了我们的设计选择。

方法

我们的软件是使用名为Processing的开源程序开发的。它加载多个序列比对FASTA文件和一个配置文件,可根据需要进行修改以更改可视化效果。

结果

重新设计的图形改进了两组或更多组的视觉比较,并且还编码了序列位置保守性的信息。在我们对腺苷酸激酶盖子结构域的案例研究中,序列多样性图揭示了意想不到的模式和新见解,例如在蛋白质亚家族中识别出亚组。我们未来的工作将把这种可视化编码集成到交互式可视化工具中,以支持更高级别的数据探索任务。

https://cdn.ncbi.nlm.nih.gov/pmc/blobs/65b6/4155614/ea7cd920090e/1753-6561-8-S2-S9-3.jpg
https://cdn.ncbi.nlm.nih.gov/pmc/blobs/65b6/4155614/117a58dd3cac/1753-6561-8-S2-S9-1.jpg
https://cdn.ncbi.nlm.nih.gov/pmc/blobs/65b6/4155614/8f4389d61fe0/1753-6561-8-S2-S9-2.jpg
https://cdn.ncbi.nlm.nih.gov/pmc/blobs/65b6/4155614/ea7cd920090e/1753-6561-8-S2-S9-3.jpg
https://cdn.ncbi.nlm.nih.gov/pmc/blobs/65b6/4155614/117a58dd3cac/1753-6561-8-S2-S9-1.jpg
https://cdn.ncbi.nlm.nih.gov/pmc/blobs/65b6/4155614/8f4389d61fe0/1753-6561-8-S2-S9-2.jpg
https://cdn.ncbi.nlm.nih.gov/pmc/blobs/65b6/4155614/ea7cd920090e/1753-6561-8-S2-S9-3.jpg

相似文献

1
Sequence Diversity Diagram for comparative analysis of multiple sequence alignments.用于多序列比对比较分析的序列多样性图。
BMC Proc. 2014 Aug 28;8(Suppl 2 Proceedings of the 3rd Annual Symposium on Biologica):S9. doi: 10.1186/1753-6561-8-S2-S9. eCollection 2014.
2
Visual BLAST and visual FASTA: graphic workbenches for interactive analysis of full BLAST and FASTA outputs under MICROSOFT WINDOWS 95/NT.可视化BLAST和可视化FASTA:用于在微软Windows 95/NT系统下对完整的BLAST和FASTA输出结果进行交互式分析的图形化工作台。
Comput Appl Biosci. 1997 Aug;13(4):407-13. doi: 10.1093/bioinformatics/13.4.407.
3
ProfileGrids: a sequence alignment visualization paradigm that avoids the limitations of Sequence Logos.轮廓网格:一种避免序列标识局限性的序列比对可视化范式。
BMC Proc. 2014 Aug 28;8(Suppl 2 Proceedings of the 3rd Annual Symposium on Biologica):S6. doi: 10.1186/1753-6561-8-S2-S6. eCollection 2014.
4
Skylign: a tool for creating informative, interactive logos representing sequence alignments and profile hidden Markov models.Skylign:一个用于创建有信息、交互性的序列比对和隐马尔可夫模型的 logo 的工具。
BMC Bioinformatics. 2014 Jan 13;15:7. doi: 10.1186/1471-2105-15-7.
5
Two Sample Logo: a graphical representation of the differences between two sets of sequence alignments.双样本标识:两组序列比对之间差异的图形表示。
Bioinformatics. 2006 Jun 15;22(12):1536-7. doi: 10.1093/bioinformatics/btl151. Epub 2006 Apr 21.
6
Using CLUSTAL for multiple sequence alignments.使用CLUSTAL进行多序列比对。
Methods Enzymol. 1996;266:383-402. doi: 10.1016/s0076-6879(96)66024-8.
7
Phylo-mLogo: an interactive and hierarchical multiple-logo visualization tool for alignment of many sequences.系统发育mLogo:一种用于多条序列比对的交互式分层多序列标识可视化工具。
BMC Bioinformatics. 2007 Feb 24;8:63. doi: 10.1186/1471-2105-8-63.
8
transAlign: using amino acids to facilitate the multiple alignment of protein-coding DNA sequences.transAlign:利用氨基酸促进蛋白质编码DNA序列的多重比对。
BMC Bioinformatics. 2005 Jun 22;6:156. doi: 10.1186/1471-2105-6-156.
9
SeqTools: visual tools for manual analysis of sequence alignments.SeqTools:用于手动分析序列比对的可视化工具。
BMC Res Notes. 2016 Jan 22;9:39. doi: 10.1186/s13104-016-1847-3.
10
Multiple DNA and protein sequence alignment based on segment-to-segment comparison.基于片段对片段比较的多DNA和蛋白质序列比对。
Proc Natl Acad Sci U S A. 1996 Oct 29;93(22):12098-103. doi: 10.1073/pnas.93.22.12098.

引用本文的文献

1
ProfileGrids: a sequence alignment visualization paradigm that avoids the limitations of Sequence Logos.轮廓网格:一种避免序列标识局限性的序列比对可视化范式。
BMC Proc. 2014 Aug 28;8(Suppl 2 Proceedings of the 3rd Annual Symposium on Biologica):S6. doi: 10.1186/1753-6561-8-S2-S6. eCollection 2014.
2
Understanding the sequence requirements of protein families: insights from the BioVis 2013 contests.理解蛋白质家族的序列要求:来自2013年生物可视化竞赛的见解。
BMC Proc. 2014 Aug 28;8(Suppl 2 Proceedings of the 3rd Annual Symposium on Biologica):S1. doi: 10.1186/1753-6561-8-S2-S1. eCollection 2014.

本文引用的文献

1
Common angle plots as perception-true visualizations of categorical associations.常见角度图作为分类关联的感知真实可视化。
IEEE Trans Vis Comput Graph. 2013 Dec;19(12):2297-305. doi: 10.1109/TVCG.2013.140.
2
BioJS: an open source JavaScript framework for biological data visualization.BioJS:用于生物数据可视化的开源 JavaScript 框架。
Bioinformatics. 2013 Apr 15;29(8):1103-4. doi: 10.1093/bioinformatics/btt100. Epub 2013 Feb 23.
3
Jalview Version 2--a multiple sequence alignment editor and analysis workbench.Jalview 2版本——一个多序列比对编辑器和分析工作台。
Bioinformatics. 2009 May 1;25(9):1189-91. doi: 10.1093/bioinformatics/btp033. Epub 2009 Jan 16.
4
Mutual information without the influence of phylogeny or entropy dramatically improves residue contact prediction.不受系统发育或熵影响的互信息显著改善了残基接触预测。
Bioinformatics. 2008 Feb 1;24(3):333-40. doi: 10.1093/bioinformatics/btm604. Epub 2007 Dec 5.
5
Parallel sets: interactive exploration and visual analysis of categorical data.平行集:分类数据的交互式探索与可视化分析
IEEE Trans Vis Comput Graph. 2006 Jul-Aug;12(4):558-68. doi: 10.1109/TVCG.2006.76.
6
Sequence logos: a new way to display consensus sequences.序列标识:一种显示共有序列的新方法。
Nucleic Acids Res. 1990 Oct 25;18(20):6097-100. doi: 10.1093/nar/18.20.6097.