Bian Jiang, Xie Mengjun, Hudson Teresa J, Eswaran Hari, Brochhausen Mathias, Hanna Josh, Hogan William R
Division of Biomedical Informatics, University of Arkansas for Medical Sciences, Little Rock, AR 72205, United States of America.
Department of Computer Science, University of Arkansas at Little Rock, Little Rock, AR 72204, United States of America.
PLoS One. 2014 Nov 18;9(11):e111928. doi: 10.1371/journal.pone.0111928. eCollection 2014.
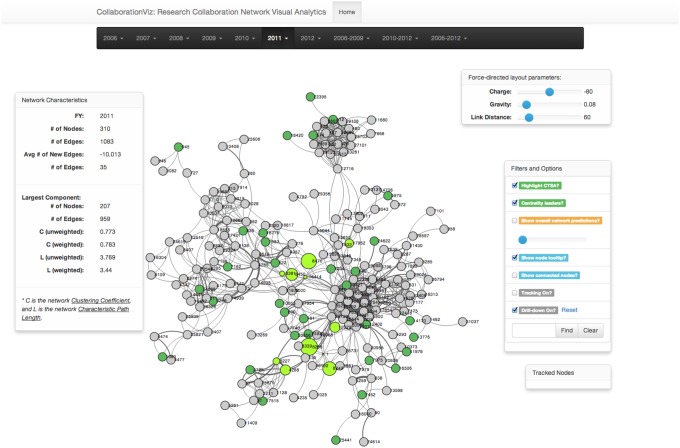
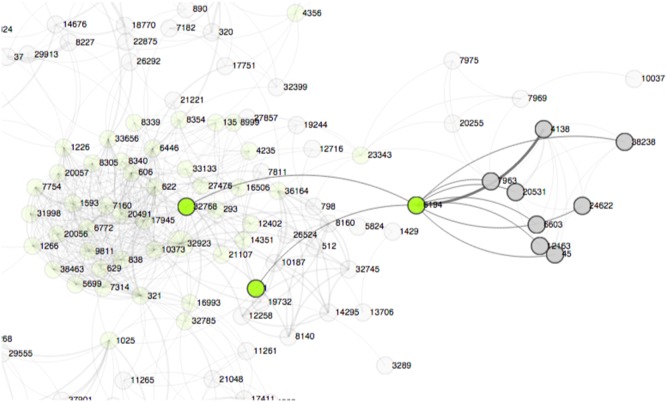
Social network analysis (SNA) helps us understand patterns of interaction between social entities. A number of SNA studies have shed light on the characteristics of research collaboration networks (RCNs). Especially, in the Clinical Translational Science Award (CTSA) community, SNA provides us a set of effective tools to quantitatively assess research collaborations and the impact of CTSA. However, descriptive network statistics are difficult for non-experts to understand. In this article, we present our experiences of building meaningful network visualizations to facilitate a series of visual analysis tasks. The basis of our design is multidimensional, visual aggregation of network dynamics. The resulting visualizations can help uncover hidden structures in the networks, elicit new observations of the network dynamics, compare different investigators and investigator groups, determine critical factors to the network evolution, and help direct further analyses. We applied our visualization techniques to explore the biomedical RCNs at the University of Arkansas for Medical Sciences--a CTSA institution. And, we created CollaborationViz, an open-source visual analytical tool to help network researchers and administration apprehend the network dynamics of research collaborations through interactive visualization.
社会网络分析(SNA)有助于我们理解社会实体之间的互动模式。许多SNA研究揭示了研究合作网络(RCN)的特征。特别是在临床转化科学奖(CTSA)社区,SNA为我们提供了一套有效的工具,用于定量评估研究合作以及CTSA的影响。然而,描述性网络统计数据对于非专家来说很难理解。在本文中,我们介绍了构建有意义的网络可视化以促进一系列视觉分析任务的经验。我们设计的基础是网络动态的多维视觉聚合。由此产生的可视化可以帮助发现网络中隐藏的结构,引出对网络动态的新观察,比较不同的研究者和研究者群体,确定网络演化的关键因素,并有助于指导进一步的分析。我们应用我们的可视化技术来探索阿肯色大学医学科学分校(一个CTSA机构)的生物医学RCN。并且,我们创建了CollaborationViz,这是一个开源的视觉分析工具,通过交互式可视化帮助网络研究人员和管理人员理解研究合作的网络动态。