Zhang Xiaodong, Tong Frank, Li Chun-Xia, Yan Yumei, Kempf Doty, Nair Govind, Wang Silun, Muly E Chris, Zola Stuart, Howell Leonard
Yerkes National Primate Research Center, Emory University, Atlanta, Georgia 30329, United States of America.
Department of Radiology, School of Medicine, Emory University, Atlanta, Georgia 30322, United States of America.
PLoS One. 2015 Feb 6;10(2):e0117290. doi: 10.1371/journal.pone.0117290. eCollection 2015.
Diffusion-weighted imaging (DWI) and perfusion MRI were used to examine the spatiotemporal evolution of stroke lesions in adult macaques with ischemic occlusion.
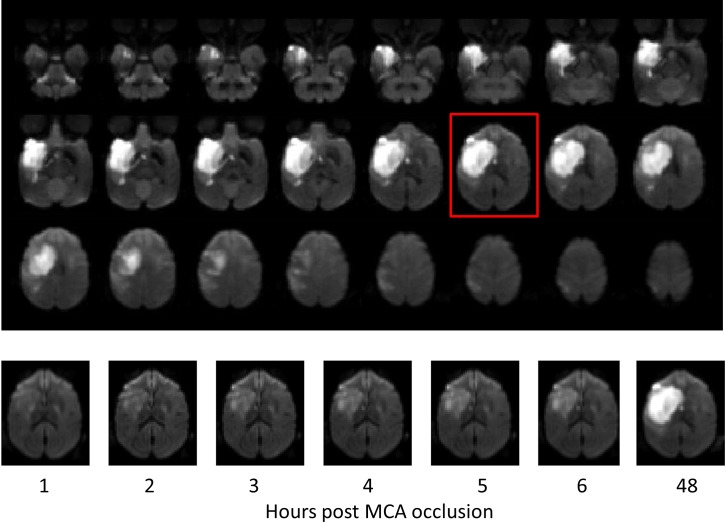
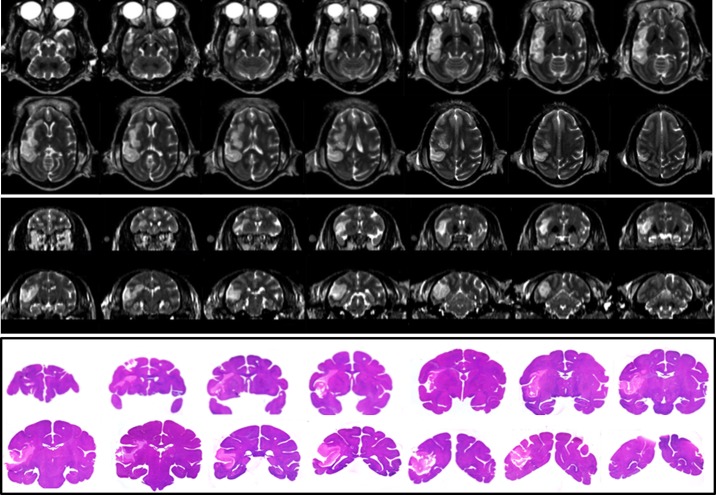
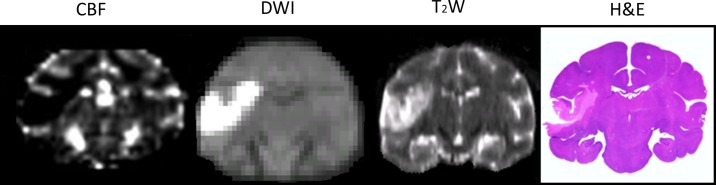
Permanent MCA occlusion was induced with silk sutures through an interventional approach via the femoral artery in adult rhesus monkeys (n = 8, 10-21 years old). The stroke lesions were examined with high-resolution DWI and perfusion MRI, and T2-weighted imaging (T2W) on a clinical 3T scanner at 1-6, 48, and 96 hours post occlusion and validated with H&E staining.
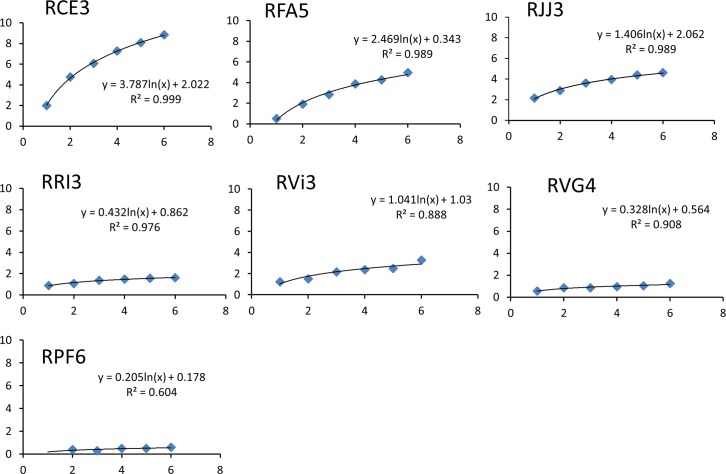
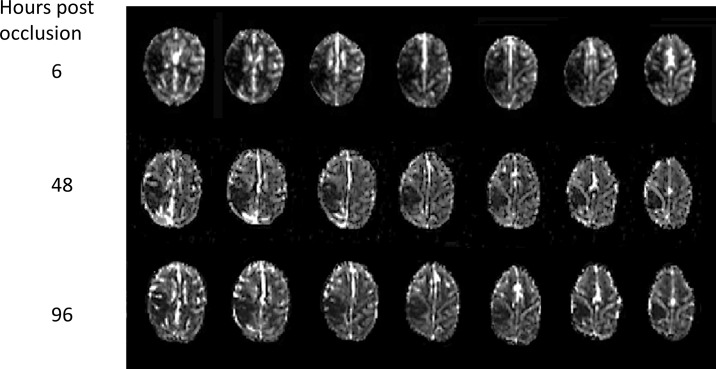
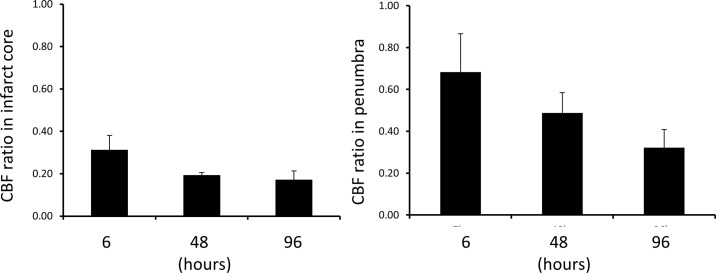
The stroke infarct evolved via a natural logarithmic pattern with the mean infarct growth rate = 1.38 ± 1.32 ml per logarithmic time scale (hours) (n = 7) in the hyperacute phase (1-6 hours). The mean infarct volume after 6 hours post occlusion was 3.6±2.8 ml (n = 7, by DWI) and increased to 3.9±2.9 ml (n = 5, by T2W) after 48 hours, and to 4.7±2.2ml (n = 3, by T2W) after 96 hours post occlusion. The infarct volumes predicted by the natural logarithmic function were correlated significantly with the T2W-derived lesion volumes (n = 5, r = 0.92, p = 0.01) at 48 hours post occlusion. The final infarct volumes derived from T2W were correlated significantly with those from H&E staining (r = 0.999, p < 0.0001, n = 4). In addition, the diffusion-perfusion mismatch was visible generally at 6 hours but nearly diminished at 48 hours post occlusion.
The infarct evolution follows a natural logarithmic pattern in the hyperacute phase of stroke. The logarithmic pattern of evolution could last up to 48 hours after stroke onset and may be used to predict the infarct volume growth during the acute phase of ischemic stroke. The nonhuman primate model, MRI protocols, and post data processing strategy may provide an excellent platform for characterizing the evolution of acute stroke lesion in mechanistic studies and therapeutic interventions of stroke disease.
采用扩散加权成像(DWI)和灌注磁共振成像(MRI)检查成年恒河猴缺血性闭塞性脑卒中病变的时空演变。
通过介入方法经股动脉用丝线缝合诱导成年恒河猴(n = 8,10 - 21岁)永久性大脑中动脉闭塞。在闭塞后1 - 6小时、48小时和96小时,使用临床3T扫描仪通过高分辨率DWI、灌注MRI和T2加权成像(T2W)检查脑卒中病变,并通过苏木精-伊红染色进行验证。
在超急性期(1 - 6小时),脑卒中梗死灶以自然对数模式演变,平均梗死灶生长速率为每对数时间尺度(小时)1.38±1.32 ml(n = 7)。闭塞后6小时的平均梗死灶体积为3.6±2.8 ml(n = 7,通过DWI),48小时后增加至3.9±2.9 ml(n = 5,通过T2W),96小时后增加至4.7±2.2 ml(n = 3,通过T2W)。自然对数函数预测的梗死灶体积与闭塞后48小时T2W得出的病变体积显著相关(n = 5,r = 0.92,p = 0.01)。T2W得出的最终梗死灶体积与苏木精-伊红染色得出的体积显著相关(r = 0.999,p < 0.0001,n = 4)。此外,扩散-灌注不匹配通常在6小时可见,但在闭塞后48小时几乎消失。
在脑卒中的超急性期,梗死灶演变遵循自然对数模式。这种对数演变模式在脑卒中发作后可持续长达48小时,可用于预测缺血性脑卒中急性期梗死灶体积的增长。非人灵长类动物模型、MRI方案和后期数据处理策略可为在脑卒中疾病的机制研究和治疗干预中表征急性脑卒中病变的演变提供一个良好的平台。