Loraine Ann E, Blakley Ivory Clabaugh, Jagadeesan Sridharan, Harper Jeff, Miller Gad, Firon Nurit
Department of Bioinformatics and Genomics, University of North Carolina at Charlotte, North Carolina Research Campus, Charlotte, NC, USA,
Methods Mol Biol. 2015;1284:481-501. doi: 10.1007/978-1-4939-2444-8_24.
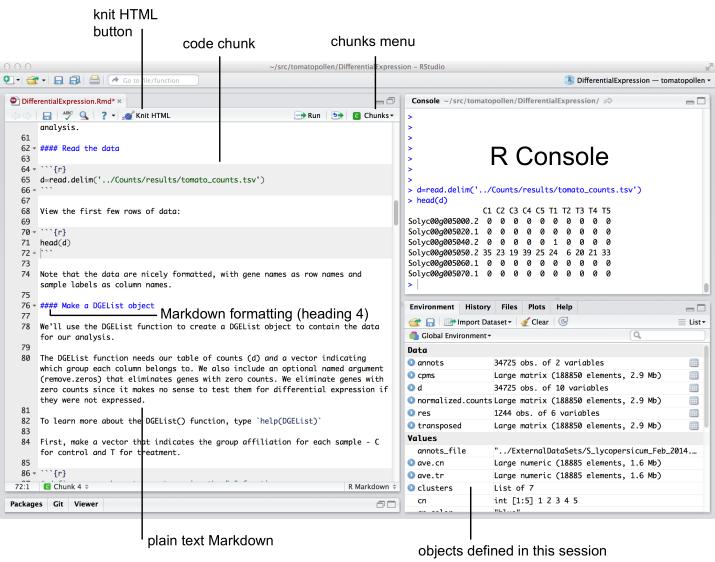
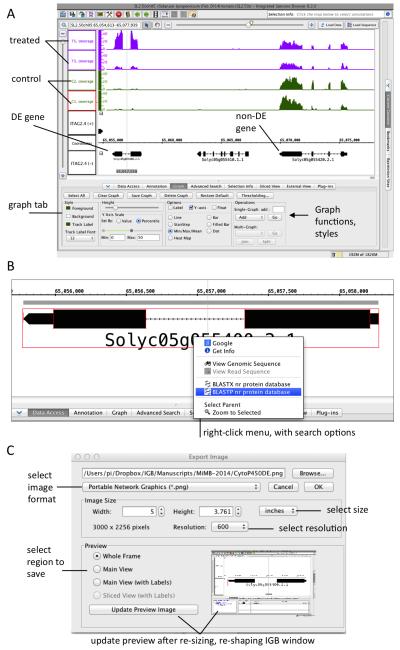
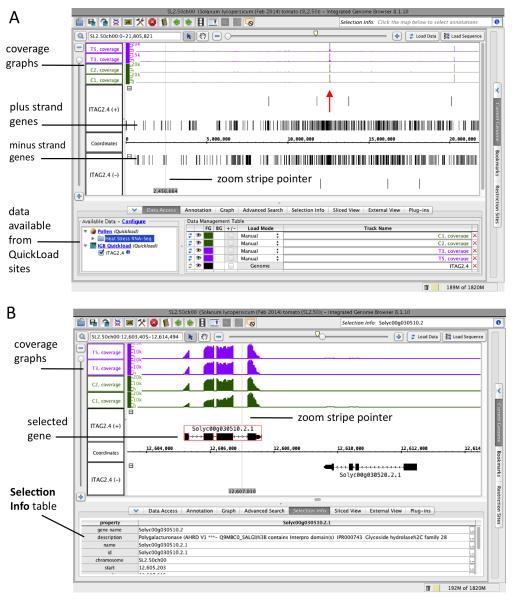
Sequencing costs are falling, but the cost of data analysis remains high, often because unforeseen problems arise, such as insufficient depth of sequencing or batch effects. Experimenting with data analysis methods during the planning phase of an experiment can reveal unanticipated problems and build valuable bioinformatics expertise in the organism or process being studied. This protocol describes using R Markdown and RStudio, user-friendly tools for statistical analysis and reproducible research in bioinformatics, to analyze and document the analysis of an example RNA-Seq data set from tomato pollen undergoing chronic heat stress. Also, we show how to use Integrated Genome Browser to visualize read coverage graphs for differentially expressed genes. Applying the protocol described here and using the provided data sets represent a useful first step toward building RNA-Seq data analysis expertise in a research group.
测序成本在下降,但数据分析成本仍然很高,这通常是因为出现了一些意想不到的问题,比如测序深度不足或批次效应。在实验规划阶段对数据分析方法进行试验,可以发现意外问题,并在正在研究的生物体或过程中积累宝贵的生物信息学专业知识。本方案描述了如何使用R Markdown和RStudio(生物信息学中用于统计分析和可重复研究的用户友好型工具)来分析和记录对来自遭受慢性热胁迫的番茄花粉的一个示例RNA测序数据集的分析。此外,我们展示了如何使用综合基因组浏览器来可视化差异表达基因的读取覆盖图。应用此处描述的方案并使用提供的数据集是研究团队积累RNA测序数据分析专业知识的有益第一步。