• 文献检索
  • 文档翻译
  • 深度研究
  • 学术资讯
  • Suppr Zotero 插件Zotero 插件
  • 邀请有礼
  • 套餐&价格
  • 历史记录
应用&插件
Suppr Zotero 插件Zotero 插件浏览器插件Mac 客户端Windows 客户端微信小程序
定价
高级版会员购买积分包购买API积分包
服务
文献检索文档翻译深度研究API 文档MCP 服务
关于我们
关于 Suppr公司介绍联系我们用户协议隐私条款
关注我们

Suppr 超能文献

核心技术专利:CN118964589B侵权必究
粤ICP备2023148730 号-1Suppr @ 2026

文献检索

告别复杂PubMed语法,用中文像聊天一样搜索,搜遍4000万医学文献。AI智能推荐,让科研检索更轻松。

立即免费搜索

文件翻译

保留排版,准确专业,支持PDF/Word/PPT等文件格式,支持 12+语言互译。

免费翻译文档

深度研究

AI帮你快速写综述,25分钟生成高质量综述,智能提取关键信息,辅助科研写作。

立即免费体验

利用慢性病和风险因素监测系统确定2003 - 2013年南澳大利亚成年人肥胖和糖尿病患病率的年龄、时期和队列效应。

The use of a chronic disease and risk factor surveillance system to determine the age, period and cohort effects on the prevalence of obesity and diabetes in South Australian adults--2003-2013.

作者信息

Taylor Anne W, Shi Zumin, Montgomerie Alicia, Dal Grande Eleonora, Campostrini Stefano

机构信息

Population Research & Outcome Studies, Discipline of Medicine, The University of Adelaide, South Australia, Australia; Ca' Foscari University, Venice, Italy.

Population Research & Outcome Studies, Discipline of Medicine, The University of Adelaide, South Australia, Australia.

出版信息

PLoS One. 2015 Apr 29;10(4):e0125233. doi: 10.1371/journal.pone.0125233. eCollection 2015.

DOI:10.1371/journal.pone.0125233
PMID:25923664
原文链接:https://pmc.ncbi.nlm.nih.gov/articles/PMC4414468/
Abstract

BACKGROUND

Age, period and cohort (APC) analyses, using representative, population-based descriptive data, provide additional understanding behind increased prevalence rates.

METHODS

Data on obesity and diabetes from the South Australian (SA) monthly chronic disease and risk factor surveillance system from July 2002 to December 2013 (n = 59,025) were used. Age was the self-reported age of the respondent at the time of the interview. Period was the year of the interview and cohort was age subtracted from the survey year. Cohort years were 1905 to 1995. All variables were treated as continuous. The age-sex standardised prevalence for obesity and diabetes was calculated using the Australia 2011 census. The APC models were constructed with ''apcfit'' in Stata.

RESULTS

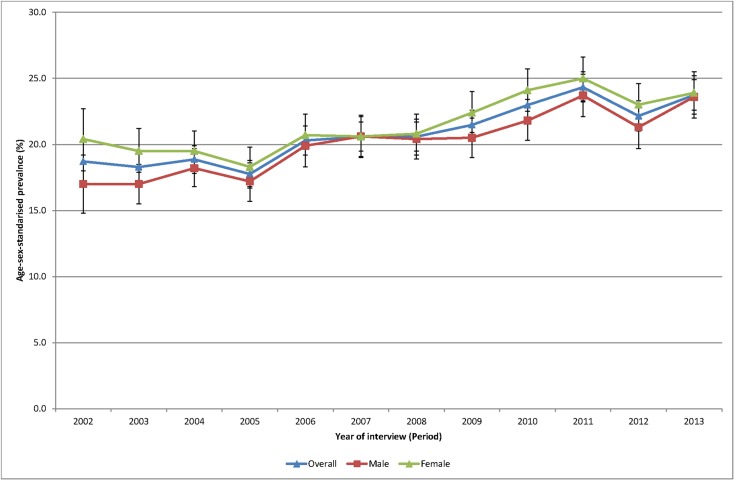
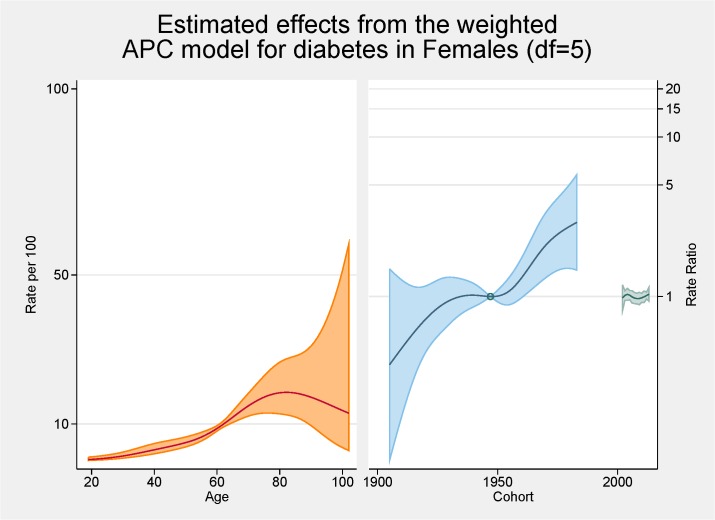
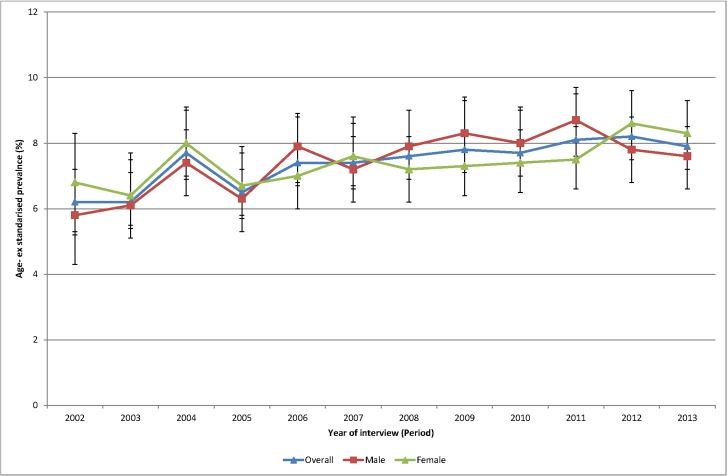
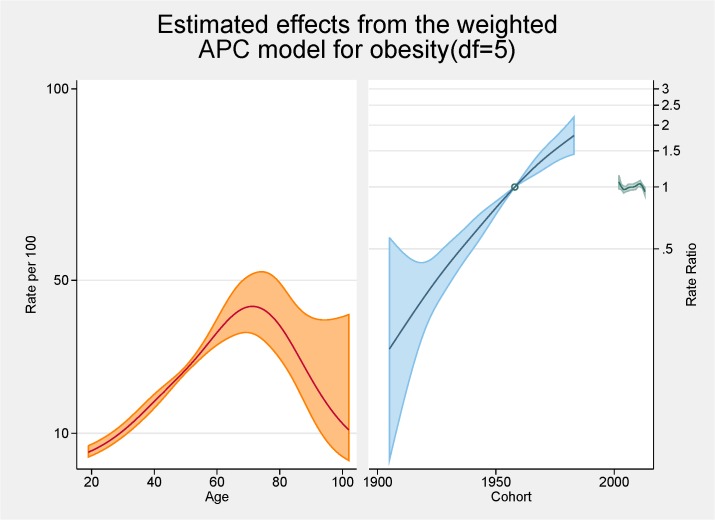
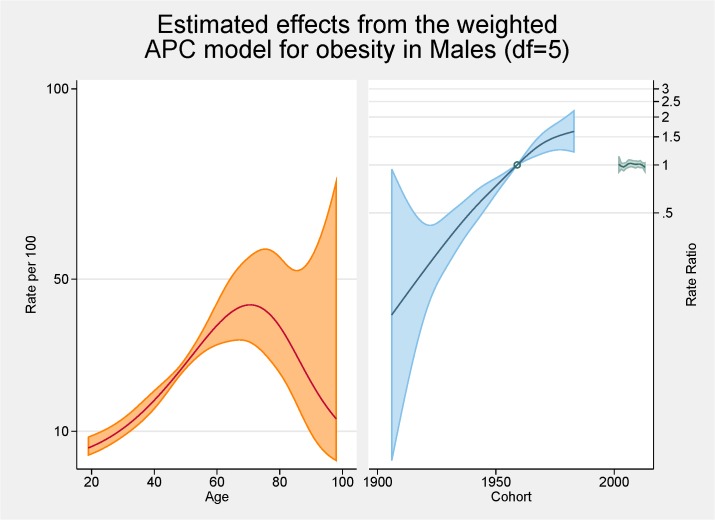
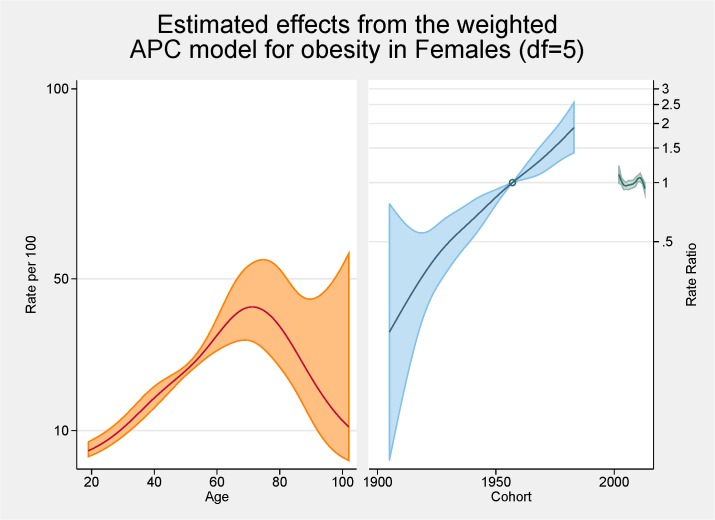
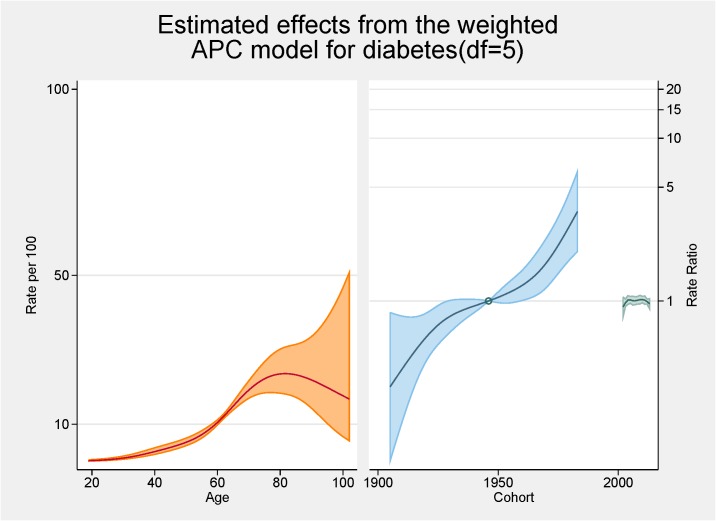
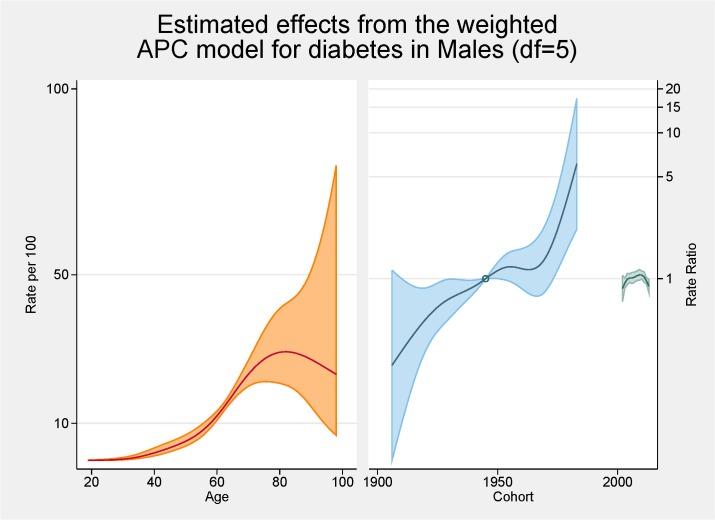
The age-sex standardised prevalence of obesity and diabetes increased in 2002-2013 from 18.6% to 24.1% and from 6.2% to 7.9%. The peak age for obesity was approximately 70 years with a steady increasing rate from 20 to 70 years of age. The peak age for diabetes was approximately 80 years. There were strong cohort effects and no period effects for both obesity and diabetes. The magnitude of the cohort effect is much more pronounced for obesity than for diabetes.

CONCLUSION

The APC analyses showed a higher than expected peak age for both obesity and diabetes, strong cohort effects with an acceleration of risk after 1960s for obesity and after 1940s for diabetes, and no period effects. By simultaneously considering the effects of age, period and cohort we have provided additional evidence for effective public health interventions.

摘要

背景

年龄、时期和队列(APC)分析利用具有代表性的基于人群的描述性数据,能让我们对患病率上升背后的原因有更深入的了解。

方法

使用了南澳大利亚州(SA)2002年7月至2013年12月每月慢性病和风险因素监测系统中关于肥胖和糖尿病的数据(n = 59,025)。年龄为受访者在访谈时自我报告的年龄。时期为访谈年份,队列是用调查年份减去年龄。队列年份为1905年至1995年。所有变量均视为连续变量。肥胖和糖尿病的年龄 - 性别标准化患病率采用澳大利亚2011年人口普查数据计算。APC模型在Stata中用“apcfit”构建。

结果

2002 - 2013年,肥胖和糖尿病的年龄 - 性别标准化患病率分别从18.6%升至24.1%,从6.2%升至7.9%。肥胖的峰值年龄约为70岁,20岁至70岁患病率稳步上升。糖尿病的峰值年龄约为80岁。肥胖和糖尿病均存在强烈的队列效应,且无时期效应。肥胖的队列效应幅度比糖尿病更为明显。

结论

APC分析显示,肥胖和糖尿病的峰值年龄均高于预期,存在强烈的队列效应,肥胖在20世纪60年代后风险加速,糖尿病在20世纪40年代后风险加速,且无时期效应。通过同时考虑年龄、时期和队列的影响,我们为有效的公共卫生干预提供了更多证据。

https://cdn.ncbi.nlm.nih.gov/pmc/blobs/946e/4414468/7b016ebefde0/pone.0125233.g008.jpg
https://cdn.ncbi.nlm.nih.gov/pmc/blobs/946e/4414468/5dfbc3a9d12f/pone.0125233.g001.jpg
https://cdn.ncbi.nlm.nih.gov/pmc/blobs/946e/4414468/82ba1debb38a/pone.0125233.g002.jpg
https://cdn.ncbi.nlm.nih.gov/pmc/blobs/946e/4414468/c9d2de5ce904/pone.0125233.g003.jpg
https://cdn.ncbi.nlm.nih.gov/pmc/blobs/946e/4414468/272a8f1f2a10/pone.0125233.g004.jpg
https://cdn.ncbi.nlm.nih.gov/pmc/blobs/946e/4414468/82ea9ceeff13/pone.0125233.g005.jpg
https://cdn.ncbi.nlm.nih.gov/pmc/blobs/946e/4414468/b9ceb3606ccb/pone.0125233.g006.jpg
https://cdn.ncbi.nlm.nih.gov/pmc/blobs/946e/4414468/6685164b7a36/pone.0125233.g007.jpg
https://cdn.ncbi.nlm.nih.gov/pmc/blobs/946e/4414468/7b016ebefde0/pone.0125233.g008.jpg

相似文献

1
The use of a chronic disease and risk factor surveillance system to determine the age, period and cohort effects on the prevalence of obesity and diabetes in South Australian adults--2003-2013.利用慢性病和风险因素监测系统确定2003 - 2013年南澳大利亚成年人肥胖和糖尿病患病率的年龄、时期和队列效应。
PLoS One. 2015 Apr 29;10(4):e0125233. doi: 10.1371/journal.pone.0125233. eCollection 2015.
2
Age, period and birth cohort effects on prevalence of overweight and obesity in Australian adults from 1990 to 2000.1990年至2000年澳大利亚成年人超重和肥胖患病率的年龄、时期和出生队列效应
Eur J Clin Nutr. 2008 Jul;62(7):898-907. doi: 10.1038/sj.ejcn.1602769. Epub 2007 Apr 18.
3
The increasing prevalence of diabetes in South Australia: the relationship with population ageing and obesity.南澳大利亚糖尿病患病率的上升:与人口老龄化和肥胖的关系。
Public Health. 2007 Feb;121(2):92-9. doi: 10.1016/j.puhe.2006.09.017. Epub 2006 Dec 12.
4
Prevalence, and associated risk factors, of self-reported diabetes mellitus in a sample of adult urban population in Greece: MEDICAL Exit Poll Research in Salamis (MEDICAL EXPRESS 2002).希腊成年城市人口样本中自我报告的糖尿病患病率及相关危险因素:萨拉米斯医疗出口民意调查研究(2002年医疗快报)
BMC Public Health. 2004 Feb 14;4:2. doi: 10.1186/1471-2458-4-2.
5
Twelve-year weight change, waist circumference change and incident obesity: the Australian diabetes, obesity and lifestyle study.十二年体重变化、腰围变化与肥胖发生:澳大利亚糖尿病、肥胖与生活方式研究。
Obesity (Silver Spring). 2014 Jun;22(6):1538-45. doi: 10.1002/oby.20704. Epub 2014 Feb 11.
6
Effects of age, time period, and birth cohort on the prevalence of diabetes and obesity in Korean men.年龄、时间段和出生队列对韩国男性糖尿病和肥胖患病率的影响。
Diabetes Care. 2008 Feb;31(2):255-60. doi: 10.2337/dc07-0531. Epub 2007 Oct 31.
7
Obesity and periodontal disease in young, middle-aged, and older adults.年轻人、中年人和老年人中的肥胖与牙周疾病
J Periodontol. 2003 May;74(5):610-5. doi: 10.1902/jop.2003.74.5.610.
8
Anthropometry measures and prevalence of obesity in the urban adult population of Cameroon: an update from the Cameroon Burden of Diabetes Baseline Survey.喀麦隆城市成年人口的人体测量指标与肥胖患病率:来自喀麦隆糖尿病负担基线调查的最新情况
BMC Public Health. 2006 Sep 13;6:228. doi: 10.1186/1471-2458-6-228.
9
BMI and metabolic disorders in South Korean adults: 1998 Korea National Health and Nutrition Survey.韩国成年人的体重指数与代谢紊乱:1998年韩国国民健康与营养调查
Obes Res. 2004 Mar;12(3):445-53. doi: 10.1038/oby.2004.50.
10
Glucose intolerance (diabetes and IGT) in a selected South Indian population with special reference to family history, obesity and lifestyle factors--the Chennai Urban Population Study (CUPS 14).特定南印度人群中的葡萄糖耐量异常(糖尿病和糖耐量受损):特别提及家族史、肥胖和生活方式因素——金奈城市人口研究(CUPS 14)
J Assoc Physicians India. 2003 Aug;51:771-7.

引用本文的文献

1
Body mass index and waist circumference trajectories across the life course and birth cohorts, 1996-2015 Malaysia: sex and ethnicity matter.生命历程和出生队列中体重指数和腰围轨迹,1996-2015 年马来西亚:性别和种族很重要。
Int J Obes (Lond). 2023 Dec;47(12):1302-1308. doi: 10.1038/s41366-023-01391-5. Epub 2023 Oct 13.
2
Changes in adult obesity prevalence in Denmark, 1987-2021: age-period-cohort analysis of nationally representative data.丹麦成人肥胖患病率的变化:基于全国代表性数据的年龄-时期-队列分析。
Eur J Public Health. 2023 Jun 1;33(3):463-467. doi: 10.1093/eurpub/ckad024.
3
Age and cohort rise in diabetes prevalence among older Australian women: Case ascertainment using survey and healthcare administrative data.

本文引用的文献

1
Trends in dental visiting avoidance due to cost in Australia, 1994 to 2010: an age-period-cohort analysis.澳大利亚因费用而避免看牙医的趋势,1994 年至 2010 年:年龄-时期-队列分析。
BMC Health Serv Res. 2013 Oct 3;13:381. doi: 10.1186/1472-6963-13-381.
2
Age-period-cohort analysis for trends in body mass index in Ireland.爱尔兰体重指数趋势的年龄-时期-队列分析。
BMC Public Health. 2013 Sep 25;13:889. doi: 10.1186/1471-2458-13-889.
3
Diabetes and cardiovascular disease outcomes in the metabolically healthy obese phenotype: a cohort study.
年龄和队列上升:老年澳大利亚女性糖尿病患病率增加:使用调查和医疗保健管理数据进行病例确定。
PLoS One. 2020 Jun 18;15(6):e0234812. doi: 10.1371/journal.pone.0234812. eCollection 2020.
4
Comparison of Health and Risk Factors of Older, Working-age Australians, Italians and Italian-born Migrants to Australia, with Data from an Italian (PASSI), and an Australian (SAMSS) Risk Factor Surveillance System.利用意大利(PASSI)和澳大利亚(SAMSS)风险因素监测系统的数据,对澳大利亚、意大利以及出生于意大利的澳大利亚移民中老年人和工作年龄段人群的健康与风险因素进行比较。
J Immigr Minor Health. 2018 Oct;20(5):1190-1196. doi: 10.1007/s10903-017-0654-9.
5
The Contribution of Ageing to Hospitalisation Days in Hong Kong: A Decomposition Analysis.人口老龄化对香港住院天数的影响:分解分析。
Int J Health Policy Manag. 2017 Mar 1;6(3):155-164. doi: 10.15171/ijhpm.2016.108.
6
Unpaid Informal Caregivers in South Australia: Population Characteristics, Prevalence and Age-Period-Cohort Effects 1994-2014.南澳大利亚的无偿非正式照料者:1994 - 2014年的人口特征、患病率及年龄 - 时期 - 队列效应
PLoS One. 2016 Sep 20;11(9):e0161994. doi: 10.1371/journal.pone.0161994. eCollection 2016.
代谢健康肥胖表型中的糖尿病和心血管疾病结局:一项队列研究。
Diabetes Care. 2013 Aug;36(8):2388-94. doi: 10.2337/dc12-1971. Epub 2013 Mar 14.
4
Birth cohort effects on abdominal obesity in the United States: the Silent Generation, Baby Boomers and Generation X.出生队列效应对美国腹部肥胖的影响:沉默一代、婴儿潮一代和 X 一代。
Int J Obes (Lond). 2013 Aug;37(8):1129-34. doi: 10.1038/ijo.2012.198. Epub 2012 Dec 11.
5
Addressing the identification problem in age-period-cohort analysis: a tutorial on the use of partial least squares and principal components analysis.解决年龄-时期-队列分析中的识别问题:偏最小二乘法和主成分分析应用教程。
Epidemiology. 2012 Jul;23(4):583-93. doi: 10.1097/EDE.0b013e31824d57a9.
6
A new approach to age-period-cohort analysis using partial least squares regression: the trend in blood pressure in the Glasgow Alumni cohort.一种使用偏最小二乘回归的年龄-时期-队列分析新方法:格拉斯哥校友队列中血压的趋势。
PLoS One. 2011 Apr 27;6(4):e19401. doi: 10.1371/journal.pone.0019401.
7
Age, period and cohort analysis of light and binge drinking in Finland, 1968-2008.1968-2008 年芬兰轻饮酒和狂饮酒的年龄、时期和队列分析。
Alcohol Alcohol. 2011 May-Jun;46(3):349-56. doi: 10.1093/alcalc/agr025.
8
Commentary: Obesity-years--a new metric to measure health effects of obesity.评论:肥胖年数——一种衡量肥胖对健康影响的新指标。
Int J Epidemiol. 2011 Aug;40(4):996-7. doi: 10.1093/ije/dyr053. Epub 2011 Apr 5.
9
Evolution of obesity prevalence in France: an age-period-cohort analysis.法国肥胖患病率的演变:一项年龄-时期-队列分析。
Epidemiology. 2010 May;21(3):360-5. doi: 10.1097/EDE.0b013e3181d5bff5.
10
What is a cohort effect? Comparison of three statistical methods for modeling cohort effects in obesity prevalence in the United States, 1971-2006.队列效应是什么?比较三种统计方法建模肥胖流行率中的队列效应,美国,1971-2006 年。
Soc Sci Med. 2010 Apr;70(7):1100-8. doi: 10.1016/j.socscimed.2009.12.018. Epub 2010 Feb 1.