Zhang Rui, Mirkovic Dragan, Newhauser Wayne D
Mary Bird Perkins Cancer Center, LA, Baton Rouge, USA.
Medical Physics Program, Department of Physics and Astronomy, Louisiana State University, LA, Baton Rouge, USA.
Radiat Oncol. 2015 Apr 28;10:107. doi: 10.1186/s13014-015-0404-x.
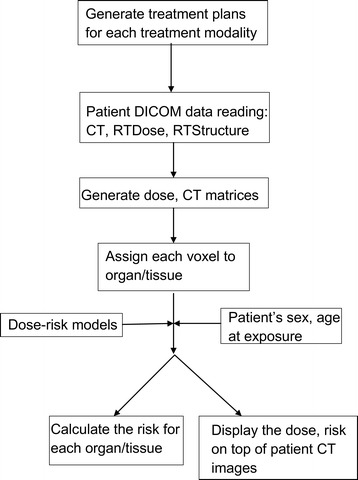
Radiogenic second cancer is a common late effect in long term cancer survivors. Currently there are few methods or tools available to visually evaluate the spatial distribution of risks of radiogenic late effects in the human body. We developed a risk visualization method and demonstrated it for radiogenic second cancers in tissues and organs of one patient treated with photon volumetric modulated arc therapy and one patient treated with proton craniospinal irradiation.
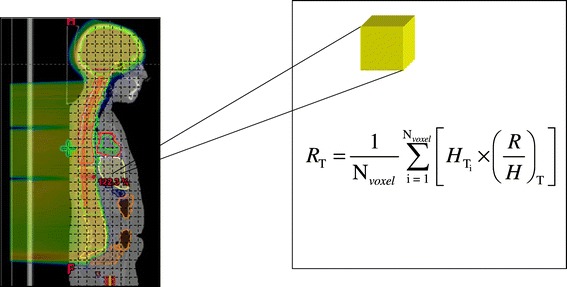
Treatment plans were generated using radiotherapy treatment planning systems (TPS) and dose information was obtained from TPS. Linear non-threshold risk coefficients for organs at risk of second cancer incidence were taken from the Biological Effects of Ionization Radiation VII report. Alternative risk models including linear exponential model and linear plateau model were also examined. The predicted absolute lifetime risk distributions were visualized together with images of the patient anatomy.
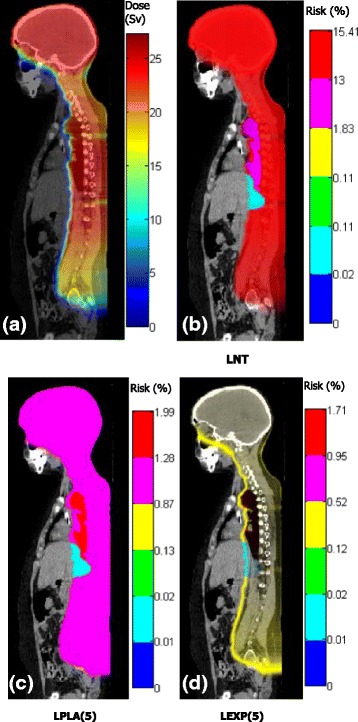
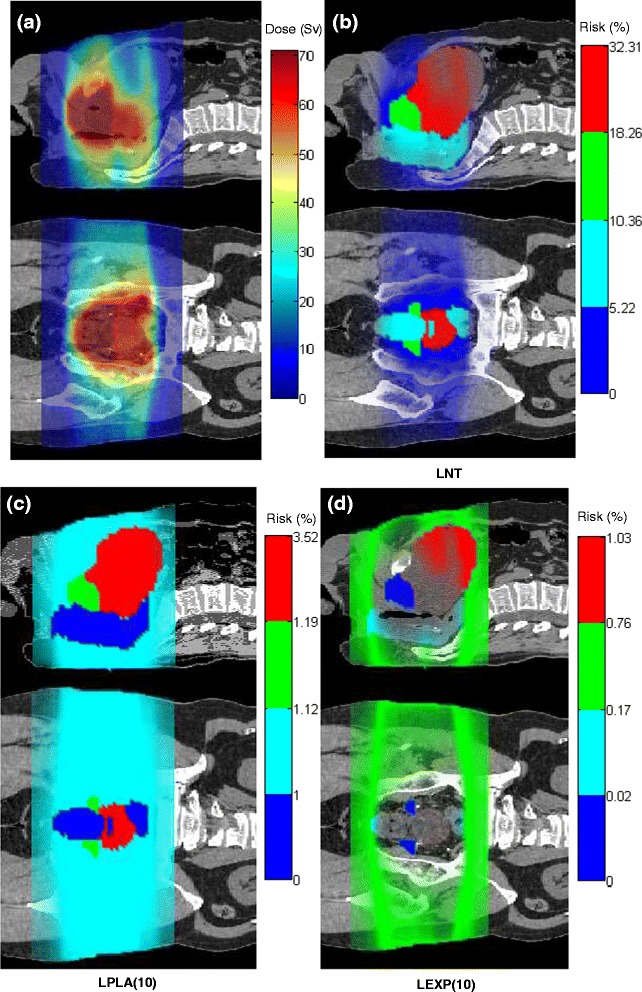
The risk distributions of second cancer for the two patients were visually presented. The risk distributions varied with tissue, dose, dose-risk model used, and the risk distribution could be similar to or very different from the dose distribution.
Our method provides a convenient way to directly visualize and evaluate the risks of radiogenic second cancer in organs and tissues of the human body. In the future, visual assessment of risk distribution could be an influential determinant for treatment plan scoring.
放射性继发癌是长期癌症幸存者常见的晚期效应。目前,几乎没有方法或工具可用于直观评估人体放射性晚期效应风险的空间分布。我们开发了一种风险可视化方法,并在一名接受光子容积调强弧形治疗的患者和一名接受质子全脑全脊髓照射的患者的组织和器官放射性继发癌中进行了演示。
使用放射治疗治疗计划系统(TPS)生成治疗计划,并从TPS获取剂量信息。继发癌发生风险器官的线性无阈风险系数取自《电离辐射生物学效应VII报告》。还研究了包括线性指数模型和线性平台模型在内的替代风险模型。将预测的绝对终生风险分布与患者解剖图像一起可视化。
直观呈现了两名患者继发癌的风险分布。风险分布随组织、剂量、所用剂量风险模型而变化,且风险分布可能与剂量分布相似或非常不同。
我们的方法提供了一种直接可视化和评估人体器官和组织中放射性继发癌风险的便捷方式。未来,风险分布的可视化评估可能成为治疗计划评分的一个有影响力的决定因素。