Nordio Francesco, Zanobetti Antonella, Colicino Elena, Kloog Itai, Schwartz Joel
TIMI Study Group, Division of Cardiovascular Medicine, Brigham and Women's Hospital, Harvard Medical School, Boston, MA, USA; Department of Environmental Health, Exposure, Epidemiology, and Risk Program, Harvard School of Public Health, Boston, MA, USA.
Department of Environmental Health, Exposure, Epidemiology, and Risk Program, Harvard School of Public Health, Boston, MA, USA.
Environ Int. 2015 Aug;81:80-6. doi: 10.1016/j.envint.2015.04.009. Epub 2015 May 25.
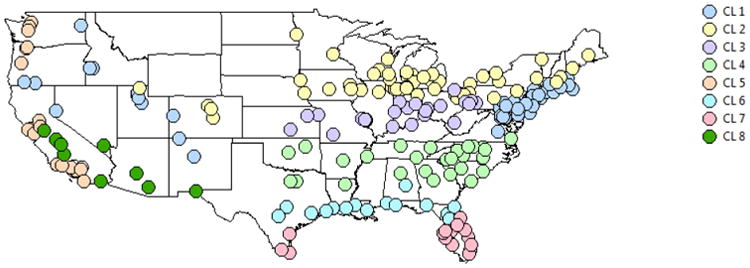
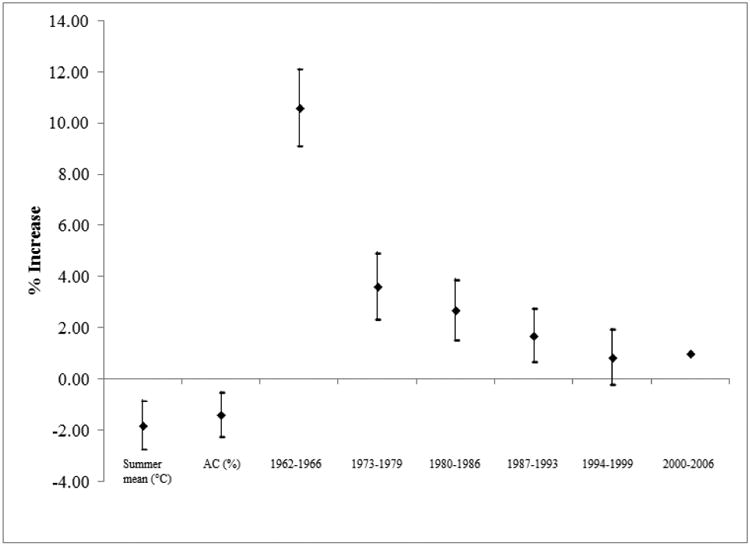
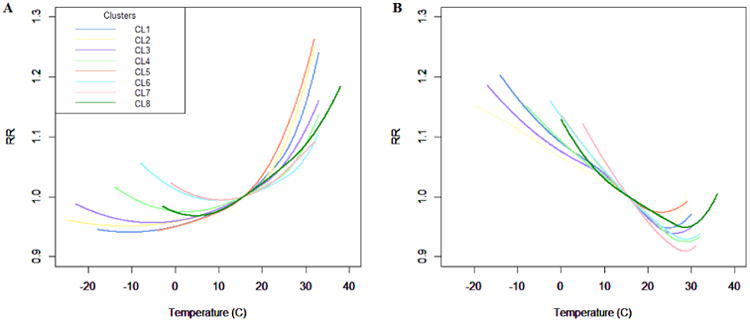
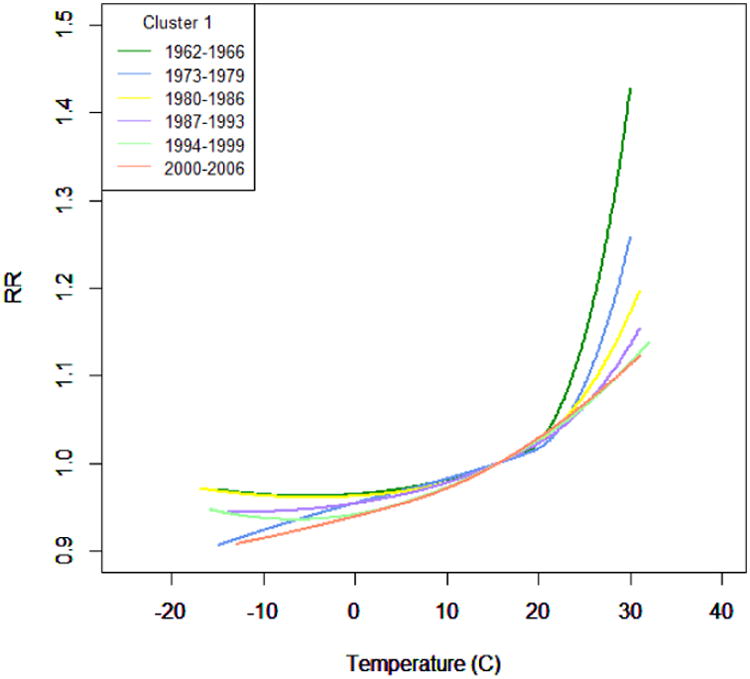
The shape of the non-linear relationship between temperature and mortality varies among cities with different climatic conditions. There has been little examination of how these curves change over space and time. We evaluated the short-term effects of hot and cold temperatures on daily mortality over six 7-year periods in 211 US cities, comprising over 42 million deaths. Cluster analysis was used to group the cities according to similar temperatures and relative humidity. Temperature-mortality functions were calculated using B-splines to model the heat effect (lag 0) and the cold effect on mortality (moving average lags 1-5). The functions were then combined through meta-smoothing and subsequently analyzed by meta-regression. We identified eight clusters. At lag 0, Cluster 5 (West Coast) had a RR of 1.14 (95% CI: 1.11,1.17) for temperatures of 27 °C vs 15.6 °C, and Cluster 6 (Gulf Coast) has a RR of 1.04 (95% CI: 1.03,1.05), suggesting that people are acclimated to their respective climates. Controlling for cluster effect in the multivariate-meta regression we found that across the US, the excess mortality from a 24-h temperature of 27 °C decreased over time from 10.6% to 0.9%. We found that the overall risk due to the heat effect is significantly affected by summer temperature mean and air condition usage, which could be a potential predictor in building climate-change scenarios.
温度与死亡率之间的非线性关系的形状在气候条件不同的城市中有所差异。关于这些曲线如何随空间和时间变化的研究很少。我们评估了美国211个城市在六个7年期间高温和低温对每日死亡率的短期影响,这些城市的死亡人数超过4200万。聚类分析用于根据相似的温度和相对湿度对城市进行分组。使用B样条计算温度-死亡率函数,以模拟热效应(滞后0)和寒冷对死亡率的影响(移动平均滞后1-5)。然后通过元平滑对这些函数进行合并,并随后通过元回归进行分析。我们识别出八个聚类。在滞后0时,对于27°C与15.6°C的温度,聚类5(西海岸)的相对风险为1.14(95%置信区间:1.11,1.17),聚类6(墨西哥湾沿岸)的相对风险为1.04(95%置信区间:1.03,1.05),这表明人们适应了各自的气候。在多变量元回归中控制聚类效应后,我们发现在美国,24小时27°C温度导致的超额死亡率随时间从10.6%降至0.9%。我们发现,热效应带来的总体风险受夏季平均温度和空调使用情况的显著影响,这可能是构建气候变化情景中的一个潜在预测指标。