• 文献检索
  • 文档翻译
  • 深度研究
  • 学术资讯
  • Suppr Zotero 插件Zotero 插件
  • 邀请有礼
  • 套餐&价格
  • 历史记录
应用&插件
Suppr Zotero 插件Zotero 插件浏览器插件Mac 客户端Windows 客户端微信小程序
定价
高级版会员购买积分包购买API积分包
服务
文献检索文档翻译深度研究API 文档MCP 服务
关于我们
关于 Suppr公司介绍联系我们用户协议隐私条款
关注我们

Suppr 超能文献

核心技术专利:CN118964589B侵权必究
粤ICP备2023148730 号-1Suppr @ 2026

文献检索

告别复杂PubMed语法,用中文像聊天一样搜索,搜遍4000万医学文献。AI智能推荐,让科研检索更轻松。

立即免费搜索

文件翻译

保留排版,准确专业,支持PDF/Word/PPT等文件格式,支持 12+语言互译。

免费翻译文档

深度研究

AI帮你快速写综述,25分钟生成高质量综述,智能提取关键信息,辅助科研写作。

立即免费体验

量化金融市场中的股票收益分布

Quantifying Stock Return Distributions in Financial Markets.

作者信息

Botta Federico, Moat Helen Susannah, Stanley H Eugene, Preis Tobias

机构信息

Centre for Complexity Science, University of Warwick, Coventry, CV4 7AL, United Kingdom; Data Science Lab, Behavioural Science, Warwick Business School, University of Warwick, Coventry, CV4 7AL, United Kingdom.

Data Science Lab, Behavioural Science, Warwick Business School, University of Warwick, Coventry, CV4 7AL, United Kingdom.

出版信息

PLoS One. 2015 Sep 1;10(9):e0135600. doi: 10.1371/journal.pone.0135600. eCollection 2015.

DOI:10.1371/journal.pone.0135600
PMID:26327593
原文链接:https://pmc.ncbi.nlm.nih.gov/articles/PMC4556674/
Abstract

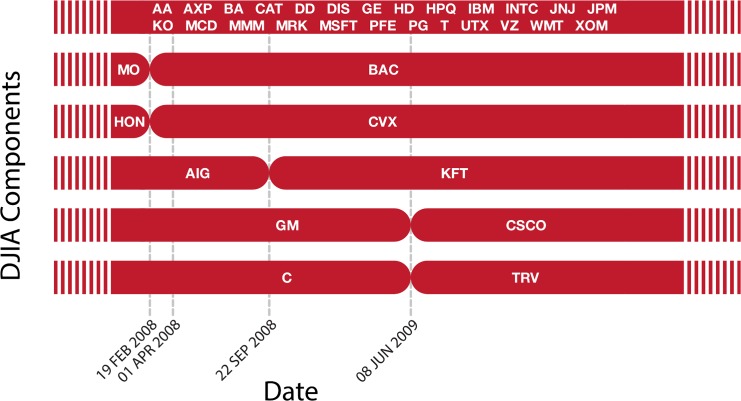
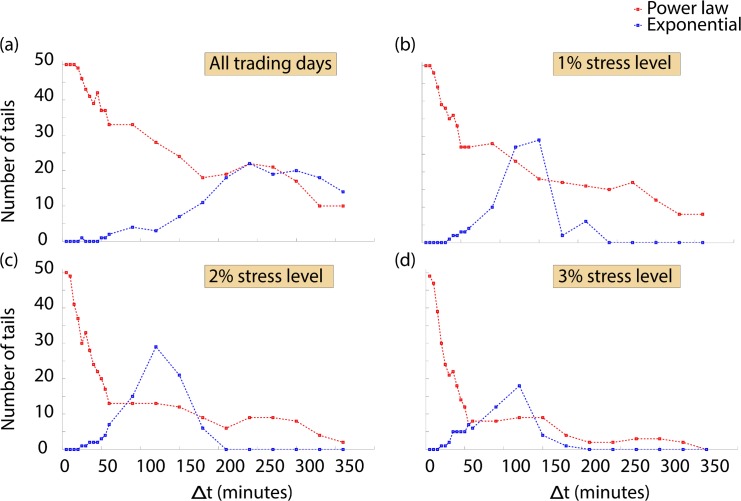
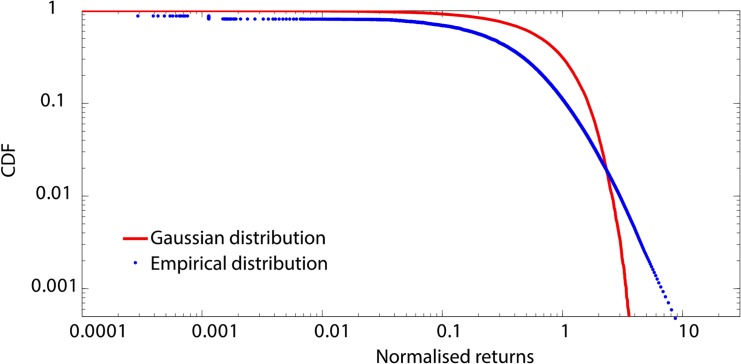
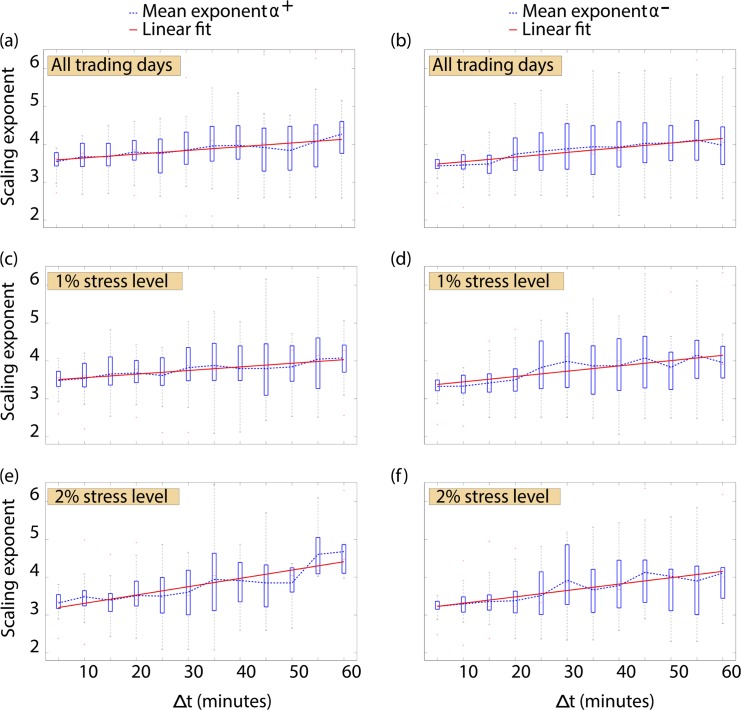
Being able to quantify the probability of large price changes in stock markets is of crucial importance in understanding financial crises that affect the lives of people worldwide. Large changes in stock market prices can arise abruptly, within a matter of minutes, or develop across much longer time scales. Here, we analyze a dataset comprising the stocks forming the Dow Jones Industrial Average at a second by second resolution in the period from January 2008 to July 2010 in order to quantify the distribution of changes in market prices at a range of time scales. We find that the tails of the distributions of logarithmic price changes, or returns, exhibit power law decays for time scales ranging from 300 seconds to 3600 seconds. For larger time scales, we find that the distributions tails exhibit exponential decay. Our findings may inform the development of models of market behavior across varying time scales.

摘要

能够量化股票市场大幅价格变动的概率对于理解影响全球人民生活的金融危机至关重要。股票市场价格的大幅变动可能在几分钟内突然出现,也可能在更长的时间尺度上发展。在这里,我们分析了一个数据集,该数据集包含2008年1月至2010年7月期间以秒为分辨率构成道琼斯工业平均指数的股票,以便量化一系列时间尺度上市场价格变化的分布。我们发现,对数价格变化(即回报)分布的尾部在300秒至3600秒的时间尺度上呈现幂律衰减。对于更大的时间尺度,我们发现分布的尾部呈现指数衰减。我们的发现可能为不同时间尺度上的市场行为模型的发展提供参考。

https://cdn.ncbi.nlm.nih.gov/pmc/blobs/f3d2/4556674/884963e6588a/pone.0135600.g004.jpg
https://cdn.ncbi.nlm.nih.gov/pmc/blobs/f3d2/4556674/e61e924a2bf4/pone.0135600.g001.jpg
https://cdn.ncbi.nlm.nih.gov/pmc/blobs/f3d2/4556674/af12c33c7f91/pone.0135600.g002.jpg
https://cdn.ncbi.nlm.nih.gov/pmc/blobs/f3d2/4556674/c61eca85271e/pone.0135600.g003.jpg
https://cdn.ncbi.nlm.nih.gov/pmc/blobs/f3d2/4556674/884963e6588a/pone.0135600.g004.jpg

相似文献

1
Quantifying Stock Return Distributions in Financial Markets.量化金融市场中的股票收益分布
PLoS One. 2015 Sep 1;10(9):e0135600. doi: 10.1371/journal.pone.0135600. eCollection 2015.
2
Impact of stock market structure on intertrade time and price dynamics.股票市场结构对交易间隔时间和价格动态的影响。
PLoS One. 2014 Apr 3;9(4):e92885. doi: 10.1371/journal.pone.0092885. eCollection 2014.
3
Quantifying the behavior of stock correlations under market stress.量化市场压力下股票相关性的行为。
Sci Rep. 2012;2:752. doi: 10.1038/srep00752. Epub 2012 Oct 18.
4
Unraveling hidden order in the dynamics of developed and emerging markets.揭示发达市场和新兴市场动态中的隐藏秩序。
PLoS One. 2014 Nov 10;9(11):e112427. doi: 10.1371/journal.pone.0112427. eCollection 2014.
5
Statistical properties and pre-hit dynamics of price limit hits in the Chinese stock markets.中国股票市场价格限制触及的统计特性与触及前动态
PLoS One. 2015 Apr 13;10(4):e0120312. doi: 10.1371/journal.pone.0120312. eCollection 2015.
6
Scaling and volatility of breakouts and breakdowns in stock price dynamics.股价动态中突破与跌破的规模及波动性。
PLoS One. 2013 Dec 23;8(12):e82771. doi: 10.1371/journal.pone.0082771. eCollection 2013.
7
Tests of nonuniversality of the stock return distributions in an emerging market.新兴市场中股票收益分布的非普遍性检验。
Phys Rev E Stat Nonlin Soft Matter Phys. 2010 Dec;82(6 Pt 2):066103. doi: 10.1103/PhysRevE.82.066103. Epub 2010 Dec 2.
8
What stock market returns to expect for the future?未来预期的股市回报是多少?
Soc Secur Bull. 2000;63(2):38-52.
9
Forecasting Financial Extremes: A Network Degree Measure of Super-Exponential Growth.预测金融极端情况:超指数增长的网络度度量
PLoS One. 2015 Sep 4;10(9):e0128908. doi: 10.1371/journal.pone.0128908. eCollection 2015.
10
Confidence and the stock market: an agent-based approach.信心与股票市场:基于主体的方法。
PLoS One. 2014 Jan 8;9(1):e83488. doi: 10.1371/journal.pone.0083488. eCollection 2014.

引用本文的文献

1
Insights from the (in)efficiency of Chinese sectoral indices during COVID-19.新冠疫情期间中国行业指数(无)效率的见解。
Physica A. 2021 Sep 15;578:126063. doi: 10.1016/j.physa.2021.126063. Epub 2021 May 20.
2
Nonlinear Stochastic Equation within an Itô Prescription for Modelling of Financial Market.用于金融市场建模的伊藤公式下的非线性随机方程
Entropy (Basel). 2019 May 25;21(5):530. doi: 10.3390/e21050530.
3
Anomaly detection in Bitcoin market via price return analysis.比特币市场的价格回报分析中的异常检测。

本文引用的文献

1
Quantifying International Travel Flows Using Flickr.利用Flickr量化国际旅行流量
PLoS One. 2015 Jul 6;10(7):e0128470. doi: 10.1371/journal.pone.0128470. eCollection 2015.
2
Quantifying crowd size with mobile phone and Twitter data.利用手机和推特数据量化人群规模。
R Soc Open Sci. 2015 May 27;2(5):150162. doi: 10.1098/rsos.150162. eCollection 2015 May.
3
Adaptive nowcasting of influenza outbreaks using Google searches.利用谷歌搜索进行流感疫情的适应性实时预测。
PLoS One. 2019 Jun 20;14(6):e0218341. doi: 10.1371/journal.pone.0218341. eCollection 2019.
4
Asymmetric impact of oil prices on stock returns in Shanghai stock exchange: Evidence from asymmetric ARDL model.油价波动对上海证券交易所股票收益的非对称影响:基于非对称 ARDL 模型的证据。
PLoS One. 2019 Jun 18;14(6):e0218289. doi: 10.1371/journal.pone.0218289. eCollection 2019.
5
Evolutionary dynamics of the cryptocurrency market.加密货币市场的演化动态。
R Soc Open Sci. 2017 Nov 15;4(11):170623. doi: 10.1098/rsos.170623. eCollection 2017 Nov.
6
Fluctuation-driven price dynamics and investment strategies.波动驱动的价格动态与投资策略。
PLoS One. 2017 Dec 14;12(12):e0189274. doi: 10.1371/journal.pone.0189274. eCollection 2017.
7
Range-based volatility, expected stock returns, and the low volatility anomaly.基于区间的波动率、预期股票回报与低波动率异象。
PLoS One. 2017 Nov 30;12(11):e0188517. doi: 10.1371/journal.pone.0188517. eCollection 2017.
8
Quantifying the Search Behaviour of Different Demographics Using Google Correlate.使用谷歌相关性工具量化不同人口统计群体的搜索行为。
PLoS One. 2016 Feb 24;11(2):e0149025. doi: 10.1371/journal.pone.0149025. eCollection 2016.
R Soc Open Sci. 2014 Oct 29;1(2):140095. doi: 10.1098/rsos.140095. eCollection 2014 Oct.
4
Identity and privacy. Unique in the shopping mall: on the reidentifiability of credit card metadata.身份与隐私。购物中心里的独特之处:信用卡元数据的可再识别性。
Science. 2015 Jan 30;347(6221):536-9. doi: 10.1126/science.1256297.
5
Quantifying the semantics of search behavior before stock market moves.量化市场变动前的搜索行为语义。
Proc Natl Acad Sci U S A. 2014 Aug 12;111(32):11600-5. doi: 10.1073/pnas.1324054111. Epub 2014 Jul 28.
6
Using big data to predict collective behavior in the real world.利用大数据预测现实世界中的集体行为。
Behav Brain Sci. 2014 Feb;37(1):92-3. doi: 10.1017/S0140525X13001817.
7
Quantifying the relationship between financial news and the stock market.量化金融新闻与股票市场之间的关系。
Sci Rep. 2013 Dec 20;3:3578. doi: 10.1038/srep03578.
8
Quantifying the digital traces of Hurricane Sandy on Flickr.量化Flickr上桑迪飓风的数字痕迹。
Sci Rep. 2013 Nov 5;3:3141. doi: 10.1038/srep03141.
9
Quantifying trading behavior in financial markets using Google Trends.使用谷歌趋势量化金融市场中的交易行为。
Sci Rep. 2013;3:1684. doi: 10.1038/srep01684.
10
Quantifying the behavior of stock correlations under market stress.量化市场压力下股票相关性的行为。
Sci Rep. 2012;2:752. doi: 10.1038/srep00752. Epub 2012 Oct 18.