• 文献检索
  • 文档翻译
  • 深度研究
  • 学术资讯
  • Suppr Zotero 插件Zotero 插件
  • 邀请有礼
  • 套餐&价格
  • 历史记录
应用&插件
Suppr Zotero 插件Zotero 插件浏览器插件Mac 客户端Windows 客户端微信小程序
定价
高级版会员购买积分包购买API积分包
服务
文献检索文档翻译深度研究API 文档MCP 服务
关于我们
关于 Suppr公司介绍联系我们用户协议隐私条款
关注我们

Suppr 超能文献

核心技术专利:CN118964589B侵权必究
粤ICP备2023148730 号-1Suppr @ 2026

文献检索

告别复杂PubMed语法,用中文像聊天一样搜索,搜遍4000万医学文献。AI智能推荐,让科研检索更轻松。

立即免费搜索

文件翻译

保留排版,准确专业,支持PDF/Word/PPT等文件格式,支持 12+语言互译。

免费翻译文档

深度研究

AI帮你快速写综述,25分钟生成高质量综述,智能提取关键信息,辅助科研写作。

立即免费体验

BactoGeNIE:用于大型显示屏的大规模比较基因组可视化工具。

BactoGeNIE: a large-scale comparative genome visualization for big displays.

作者信息

Aurisano Jillian, Reda Khairi, Johnson Andrew, Marai Elisabeta G, Leigh Jason

出版信息

BMC Bioinformatics. 2015;16 Suppl 11(Suppl 11):S6. doi: 10.1186/1471-2105-16-S11-S6. Epub 2015 Aug 13.

DOI:10.1186/1471-2105-16-S11-S6
PMID:26329021
原文链接:https://pmc.ncbi.nlm.nih.gov/articles/PMC4547189/
Abstract

BACKGROUND

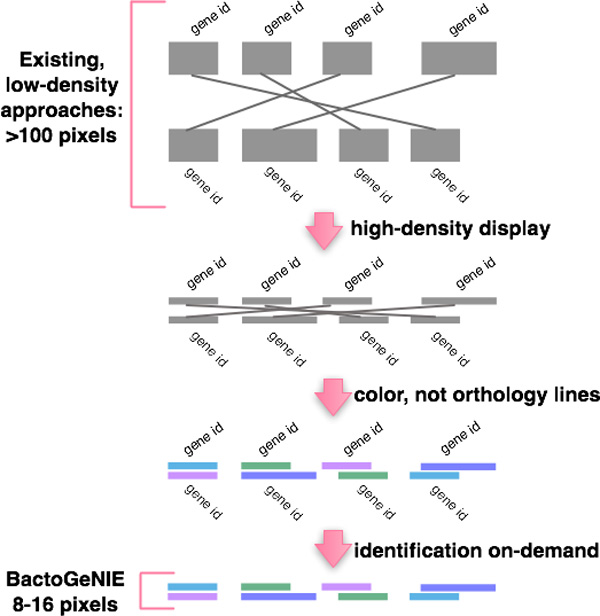
The volume of complete bacterial genome sequence data available to comparative genomics researchers is rapidly increasing. However, visualizations in comparative genomics--which aim to enable analysis tasks across collections of genomes--suffer from visual scalability issues. While large, multi-tiled and high-resolution displays have the potential to address scalability issues, new approaches are needed to take advantage of such environments, in order to enable the effective visual analysis of large genomics datasets.

RESULTS

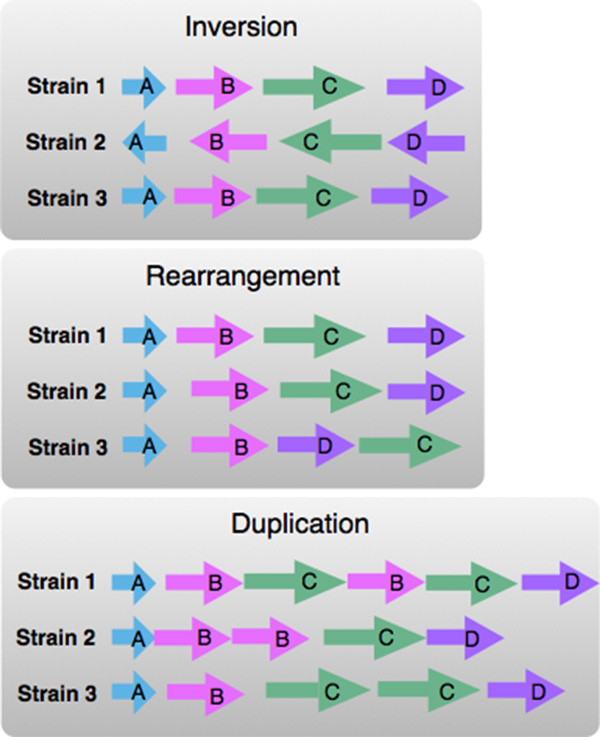
In this paper, we present Bacterial Gene Neighborhood Investigation Environment, or BactoGeNIE, a novel and visually scalable design for comparative gene neighborhood analysis on large display environments. We evaluate BactoGeNIE through a case study on close to 700 draft Escherichia coli genomes, and present lessons learned from our design process.

CONCLUSIONS

BactoGeNIE accommodates comparative tasks over substantially larger collections of neighborhoods than existing tools and explicitly addresses visual scalability. Given current trends in data generation, scalable designs of this type may inform visualization design for large-scale comparative research problems in genomics.

摘要

背景

可供比较基因组学研究人员使用的完整细菌基因组序列数据量正在迅速增加。然而,比较基因组学中的可视化——旨在实现跨基因组集合的分析任务——存在视觉可扩展性问题。虽然大型、多平铺和高分辨率显示器有可能解决可扩展性问题,但需要新的方法来利用此类环境,以便能够对大型基因组数据集进行有效的视觉分析。

结果

在本文中,我们展示了细菌基因邻域研究环境(Bacterial Gene Neighborhood Investigation Environment,简称BactoGeNIE),这是一种用于在大型显示环境中进行比较基因邻域分析的新颖且具有视觉可扩展性的设计。我们通过对近700个大肠杆菌草图基因组的案例研究来评估BactoGeNIE,并展示从我们的设计过程中学到的经验教训。

结论

与现有工具相比,BactoGeNIE能够处理数量大得多的邻域集合上的比较任务,并明确解决了视觉可扩展性问题。鉴于当前数据生成的趋势,这种类型的可扩展设计可能为基因组学中大规模比较研究问题的可视化设计提供参考。

https://cdn.ncbi.nlm.nih.gov/pmc/blobs/5497/4547189/8e646037623e/1471-2105-16-S11-S6-8.jpg
https://cdn.ncbi.nlm.nih.gov/pmc/blobs/5497/4547189/2d1511668cd8/1471-2105-16-S11-S6-1.jpg
https://cdn.ncbi.nlm.nih.gov/pmc/blobs/5497/4547189/f28dc8e2eeee/1471-2105-16-S11-S6-2.jpg
https://cdn.ncbi.nlm.nih.gov/pmc/blobs/5497/4547189/5e289bc9a0a6/1471-2105-16-S11-S6-3.jpg
https://cdn.ncbi.nlm.nih.gov/pmc/blobs/5497/4547189/cb4d5d1e18fd/1471-2105-16-S11-S6-4.jpg
https://cdn.ncbi.nlm.nih.gov/pmc/blobs/5497/4547189/7f8bd7e0bace/1471-2105-16-S11-S6-5.jpg
https://cdn.ncbi.nlm.nih.gov/pmc/blobs/5497/4547189/2213aba6152b/1471-2105-16-S11-S6-6.jpg
https://cdn.ncbi.nlm.nih.gov/pmc/blobs/5497/4547189/f069ad5378b3/1471-2105-16-S11-S6-7.jpg
https://cdn.ncbi.nlm.nih.gov/pmc/blobs/5497/4547189/8e646037623e/1471-2105-16-S11-S6-8.jpg

相似文献

1
BactoGeNIE: a large-scale comparative genome visualization for big displays.BactoGeNIE:用于大型显示屏的大规模比较基因组可视化工具。
BMC Bioinformatics. 2015;16 Suppl 11(Suppl 11):S6. doi: 10.1186/1471-2105-16-S11-S6. Epub 2015 Aug 13.
2
Epiviz: a view inside the design of an integrated visual analysis software for genomics.Epiviz:一款基因组学集成视觉分析软件的设计剖析
BMC Bioinformatics. 2015;16 Suppl 11(Suppl 11):S4. doi: 10.1186/1471-2105-16-S11-S4. Epub 2015 Aug 13.
3
Sequence Surveyor: leveraging overview for scalable genomic alignment visualization.序列勘测器:利用概览实现可扩展的基因组比对可视化。
IEEE Trans Vis Comput Graph. 2011 Dec;17(12):2392-401. doi: 10.1109/TVCG.2011.232.
4
CoGenT++: an extensive and extensible data environment for computational genomics.CoGenT++:一个用于计算基因组学的广泛且可扩展的数据环境。
Bioinformatics. 2005 Oct 1;21(19):3806-10. doi: 10.1093/bioinformatics/bti579.
5
SynerClust: a highly scalable, synteny-aware orthologue clustering tool.SynerClust:一个高度可扩展的、具有同线性感知的直系同源聚类工具。
Microb Genom. 2018 Nov;4(11). doi: 10.1099/mgen.0.000231. Epub 2018 Nov 12.
6
PathRings: a web-based tool for exploration of ortholog and expression data in biological pathways.PathRings:一个用于探索生物途径中直系同源基因和表达数据的基于网络的工具。
BMC Bioinformatics. 2015 May 19;16(1):165. doi: 10.1186/s12859-015-0585-1.
7
Pan-Tetris: an interactive visualisation for Pan-genomes.泛基因组的Pan-Tetris交互式可视化工具
BMC Bioinformatics. 2015;16 Suppl 11(Suppl 11):S3. doi: 10.1186/1471-2105-16-S11-S3. Epub 2015 Aug 13.
8
Comparative visualization of genetic and physical maps with Strudel.用 Strudel 进行遗传图谱和物理图谱的对比可视化。
Bioinformatics. 2011 May 1;27(9):1307-8. doi: 10.1093/bioinformatics/btr111. Epub 2011 Mar 3.
9
PanWeb: A web interface for pan-genomic analysis.PanWeb:用于泛基因组分析的网络界面。
PLoS One. 2017 May 24;12(5):e0178154. doi: 10.1371/journal.pone.0178154. eCollection 2017.
10
Toward almost closed genomes with GapFiller.使用 GapFiller 实现近乎闭合的基因组。
Genome Biol. 2012 Jun 25;13(6):R56. doi: 10.1186/gb-2012-13-6-r56.

引用本文的文献

1
Visual Analysis and Detection of Contrails in Aircraft Engine Simulations.飞机发动机模拟中的凝结尾迹的视觉分析与检测。
IEEE Trans Vis Comput Graph. 2023 Jan;29(1):798-808. doi: 10.1109/TVCG.2022.3209356. Epub 2022 Dec 16.
2
Multi-View Design Patterns and Responsive Visualization for Genomics Data.多视图设计模式与基因组学数据的响应式可视化
IEEE Trans Vis Comput Graph. 2023 Jan;29(1):559-569. doi: 10.1109/TVCG.2022.3209398. Epub 2022 Dec 21.
3
Tasks, Techniques, and Tools for Genomic Data Visualization.基因组数据可视化的任务、技术和工具。

本文引用的文献

1
Visualizing large, heterogeneous data in hybrid-reality environments.在混合现实环境中可视化大型异构数据。
IEEE Comput Graph Appl. 2013 Jul-Aug;33(4):38-48. doi: 10.1109/MCG.2013.37.
2
Hybrid-image visualization for large viewing environments.用于大视场环境的混合图像可视化。
IEEE Trans Vis Comput Graph. 2013 Dec;19(12):2346-55. doi: 10.1109/TVCG.2013.163.
3
Sequence Surveyor: leveraging overview for scalable genomic alignment visualization.序列勘测器:利用概览实现可扩展的基因组比对可视化。
Comput Graph Forum. 2019 Jun;38(3):781-805. doi: 10.1111/cgf.13727. Epub 2019 Jul 10.
4
Activity-Centered Domain Characterization for Problem-Driven Scientific Visualization.面向问题驱动科学可视化的活动中心领域特征描述。
IEEE Trans Vis Comput Graph. 2018 Jan;24(1):913-922. doi: 10.1109/TVCG.2017.2744459. Epub 2017 Aug 29.
5
Highlights from the 5th Symposium on Biological Data Visualization: Part 1.第五届生物数据可视化研讨会亮点:第一部分。
BMC Bioinformatics. 2015;16 Suppl 11(Suppl 11):S1. doi: 10.1186/1471-2105-16-S11-S1. Epub 2015 Aug 13.
IEEE Trans Vis Comput Graph. 2011 Dec;17(12):2392-401. doi: 10.1109/TVCG.2011.232.
4
Visualizing genomes: techniques and challenges.基因组可视化:技术与挑战。
Nat Methods. 2010 Mar;7(3 Suppl):S5-S15. doi: 10.1038/nmeth.1422. Epub 2010 Feb 25.
5
CD-HIT Suite: a web server for clustering and comparing biological sequences.CD-HIT 套件:用于聚类和比较生物序列的网络服务器。
Bioinformatics. 2010 Mar 1;26(5):680-2. doi: 10.1093/bioinformatics/btq003. Epub 2010 Jan 6.
6
A nested model for visualization design and validation.嵌套模型用于可视化设计和验证。
IEEE Trans Vis Comput Graph. 2009 Nov-Dec;15(6):921-8. doi: 10.1109/TVCG.2009.111.
7
MizBee: a multiscale synteny browser.MizBee:一个多尺度同线性浏览器。
IEEE Trans Vis Comput Graph. 2009 Nov-Dec;15(6):897-904. doi: 10.1109/TVCG.2009.167.
8
PSAT: a web tool to compare genomic neighborhoods of multiple prokaryotic genomes.PSAT:一个用于比较多个原核生物基因组的基因组邻域的网络工具。
BMC Bioinformatics. 2008 Mar 26;9:170. doi: 10.1186/1471-2105-9-170.
9
SynView: a GBrowse-compatible approach to visualizing comparative genome data.SynView:一种与GBrowse兼容的用于可视化比较基因组数据的方法。
Bioinformatics. 2006 Sep 15;22(18):2308-9. doi: 10.1093/bioinformatics/btl389. Epub 2006 Jul 14.
10
SynBrowse: a synteny browser for comparative sequence analysis.SynBrowse:用于比较序列分析的共线性浏览器。
Bioinformatics. 2005 Sep 1;21(17):3461-8. doi: 10.1093/bioinformatics/bti555. Epub 2005 Jun 30.