Nusrat S, Harbig T, Gehlenborg N
Department of Biomedical Informatics, Harvard Medical School, Boston, MA, USA.
Comput Graph Forum. 2019 Jun;38(3):781-805. doi: 10.1111/cgf.13727. Epub 2019 Jul 10.
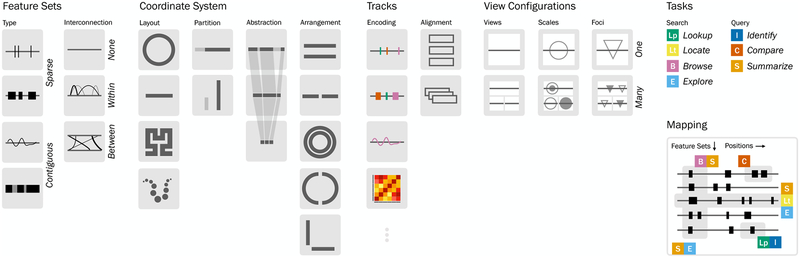
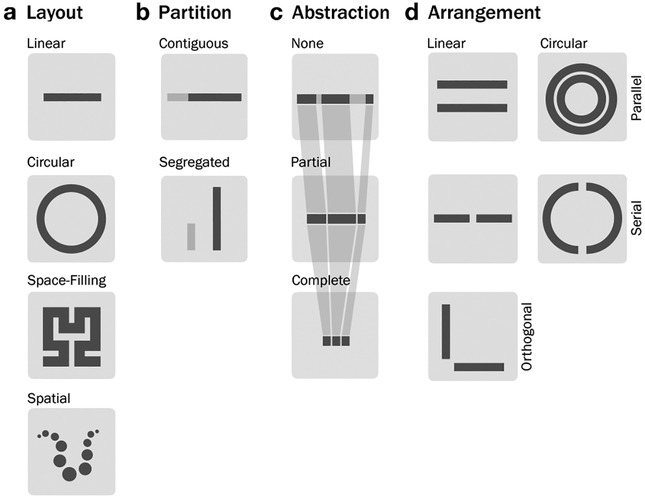
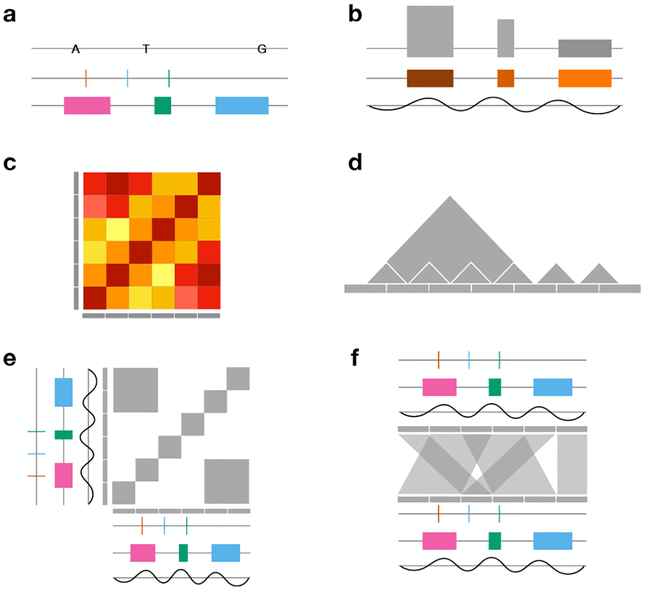
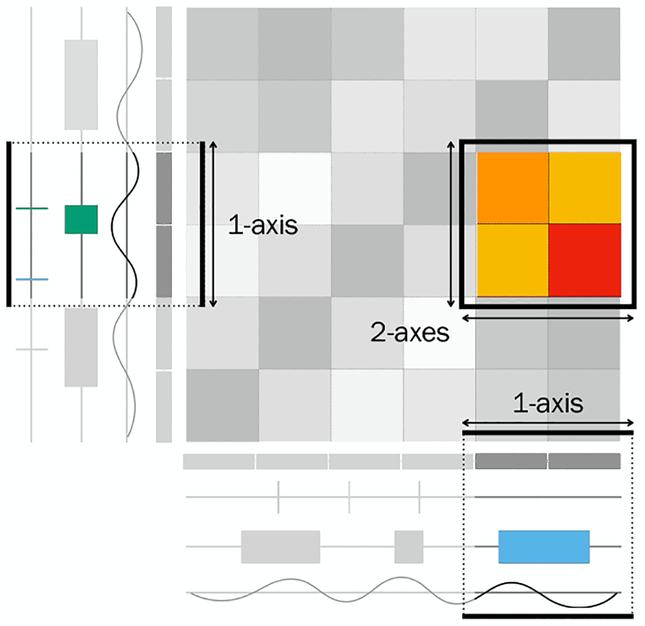
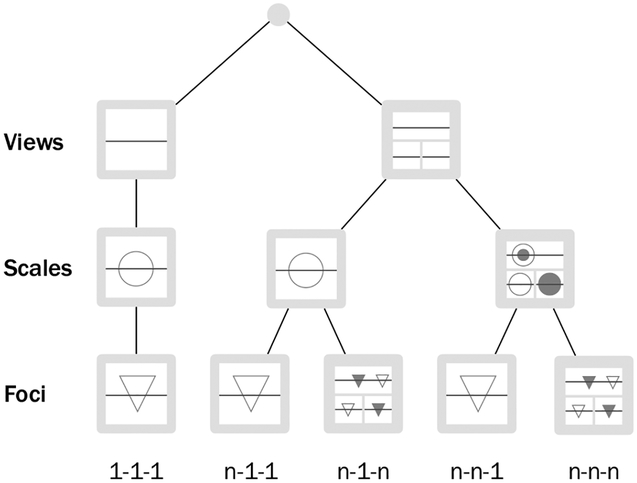
Genomic data visualization is essential for interpretation and hypothesis generation as well as a valuable aid in communicating discoveries. Visual tools bridge the gap between algorithmic approaches and the cognitive skills of investigators. Addressing this need has become crucial in genomics, as biomedical research is increasingly data-driven and many studies lack well-defined hypotheses. A key challenge in data-driven research is to discover unexpected patterns and to formulate hypotheses in an unbiased manner in vast amounts of genomic and other associated data. Over the past two decades, this has driven the development of numerous data visualization techniques and tools for visualizing genomic data. Based on a comprehensive literature survey, we propose taxonomies for data, visualization, and tasks involved in genomic data visualization. Furthermore, we provide a comprehensive review of published genomic visualization tools in the context of the proposed taxonomies.
基因组数据可视化对于解释数据、提出假设以及在交流研究发现方面提供有价值的帮助至关重要。可视化工具弥合了算法方法与研究人员认知技能之间的差距。随着生物医学研究越来越由数据驱动且许多研究缺乏明确的假设,满足这一需求在基因组学中变得至关重要。数据驱动研究中的一个关键挑战是在大量的基因组及其他相关数据中发现意外模式并以无偏的方式提出假设。在过去二十年中,这推动了众多用于可视化基因组数据的数据可视化技术和工具的发展。基于全面的文献调查,我们提出了基因组数据可视化中涉及的数据、可视化及任务的分类法。此外,我们在所提出的分类法背景下对已发表的基因组可视化工具进行了全面综述。