Wood Peter W, Gibson Patrick H, Becher Harald
ABACUS, Mazankowski Alberta Heart Institute, University of Alberta Hospital , 0A8.32, 8440 - 112 Street, Edmonton, Alberta , Canada T6G 2B7.
Echo Res Pract. 2014 Dec 1;1(2):51-60. doi: 10.1530/ERP-14-0051. Epub 2014 Oct 9.
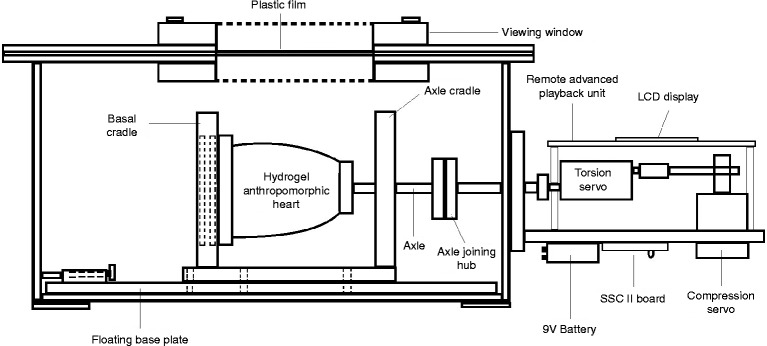
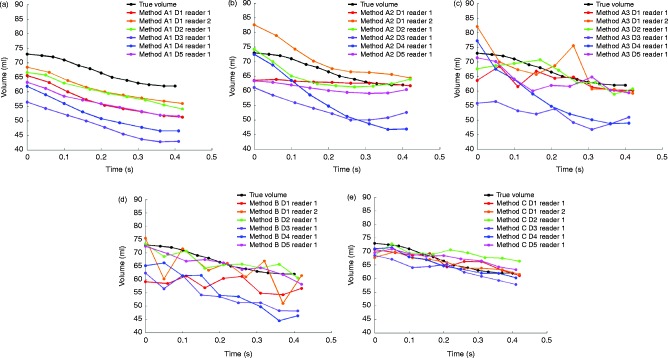
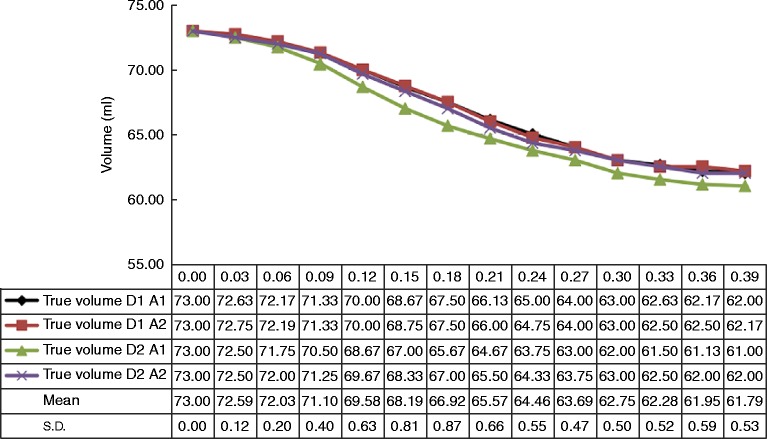
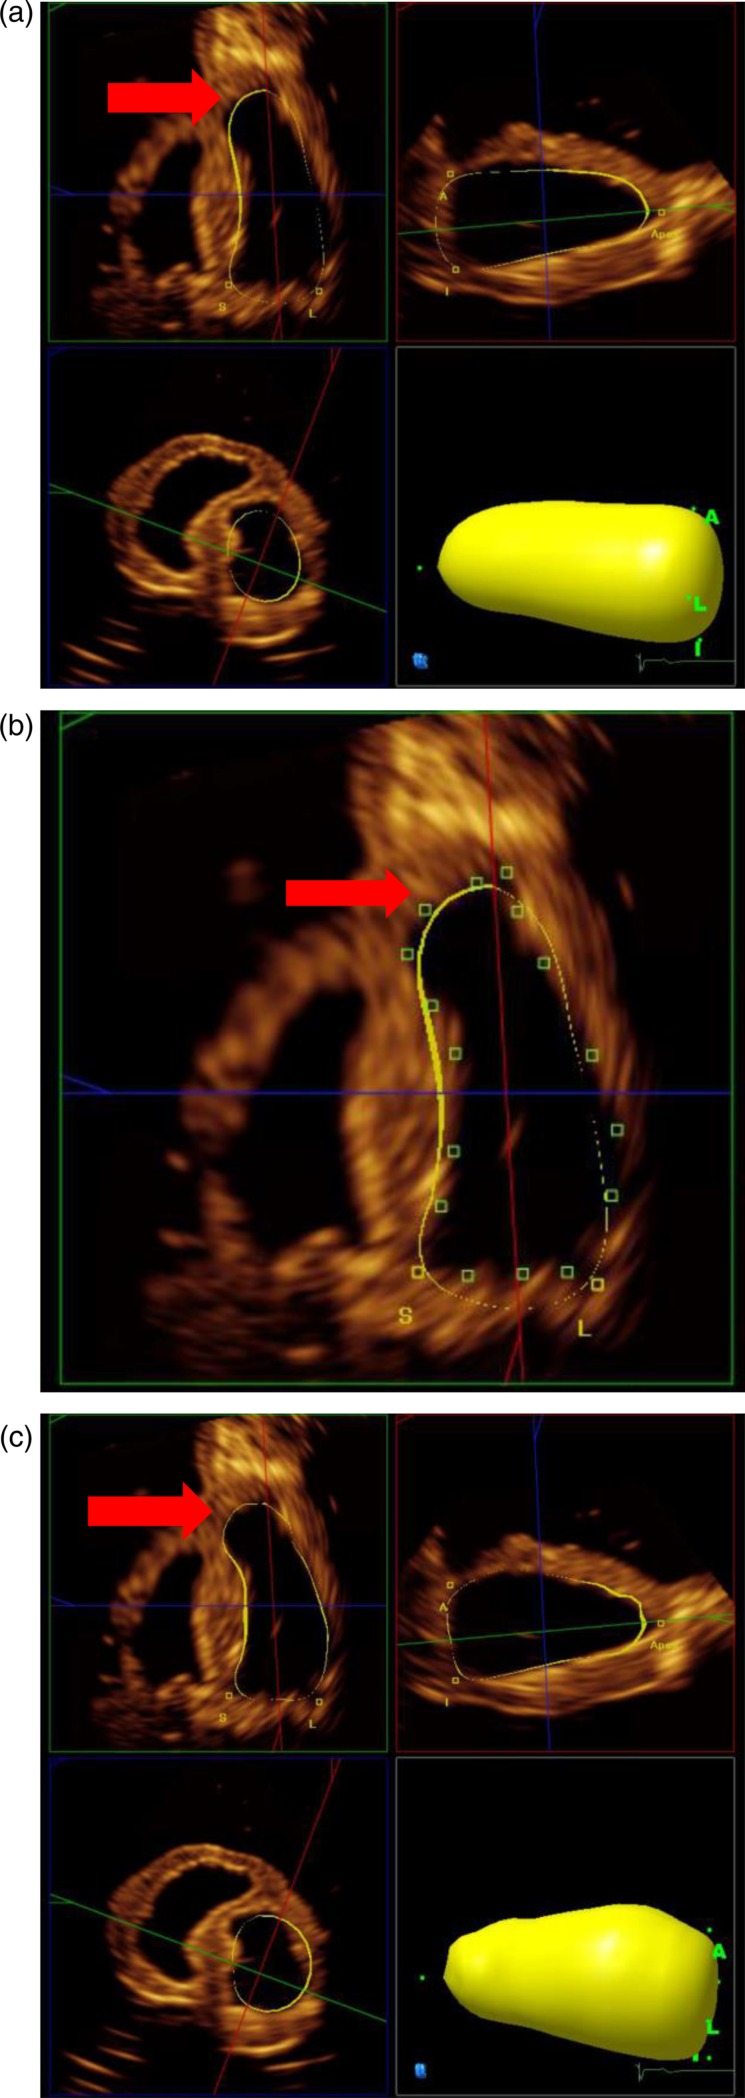
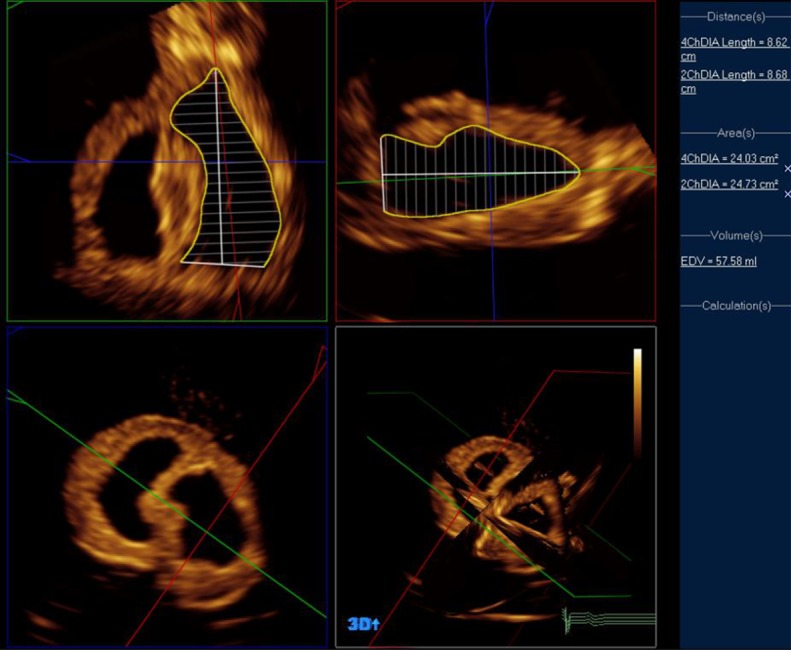
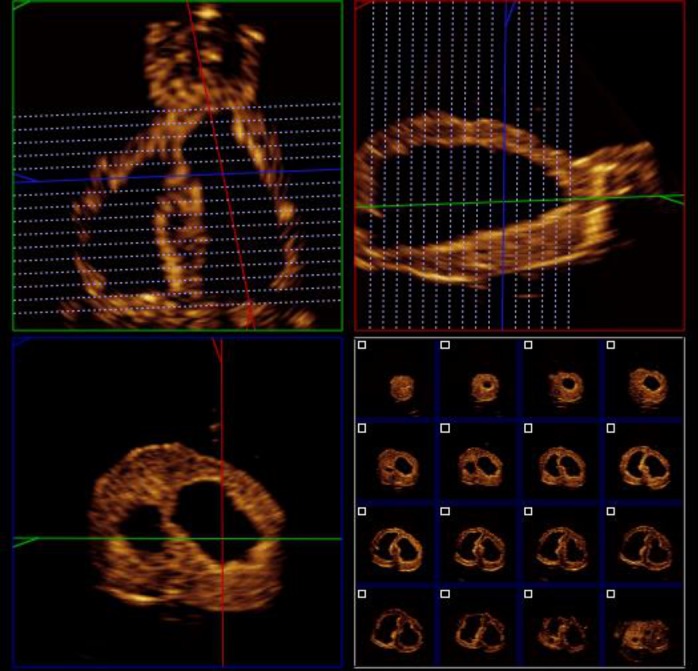
Several methods of analysis are available for quantification of left ventricular volumes and ejection fraction using three-dimensional (3D) echocardiography. This study compared the accuracy and reproducibility of five methods of analysis in a novel, irregularly shaped dynamic heart phantom with excellent image quality. Five 3D datasets were acquired on a Philips IE33 platform using an X5-1 3D transducer. Each dataset was analysed by five different methods using the Philips QLab v8.1 software: Methods A1, A2 and A3, semi-automated contour detection with varying degrees of user correction; Method B, Simpson's biplane method using optimally aligned four- and two-chamber views and Method C, method of discs, manually delineated in reconstructed short-axis views. Time-volume curves were generated for each method and compared with the true volumes measured throughout systole in the phantom heart. A second observer repeated measurements by each method in a single 3D dataset. Method A1 (uncorrected semi-automated contouring) produced the most consistent time-volume curves, although end-diastolic and end-systolic volumes varied between datasets. Any manual correction of contours (Methods A2, A3 and B) resulted in significant variation in the time-volume curves, with less consistent endocardial tracking. Method C was not only the most accurate and reproducible method, but also the most time-consuming one. Different methods of 3D volume quantification vary significantly in accuracy and reproducibility using an irregular phantom heart model. Although contouring may appear optimal in long-axis views, this may not be replicated circumferentially, and the resulting measures appeared to be less robust following the manual correction of semi-automated contours.
有几种分析方法可用于通过三维(3D)超声心动图对左心室容积和射血分数进行定量分析。本研究在具有出色图像质量的新型不规则形状动态心脏模型中比较了五种分析方法的准确性和可重复性。使用X5-1 3D换能器在飞利浦IE33平台上采集了五个3D数据集。每个数据集使用飞利浦QLab v8.1软件通过五种不同方法进行分析:方法A1、A2和A3,具有不同程度用户校正的半自动轮廓检测;方法B,使用最佳对齐的四腔和两腔视图的辛普森双平面法;方法C,在重建的短轴视图中手动描绘的圆盘法。为每种方法生成时间-容积曲线,并与在模型心脏整个收缩期测量的真实容积进行比较。第二位观察者在单个3D数据集中通过每种方法重复测量。方法A1(未校正的半自动轮廓描绘)产生了最一致的时间-容积曲线,尽管舒张末期和收缩末期容积在不同数据集之间有所变化。对轮廓进行任何手动校正(方法A2、A3和B)都会导致时间-容积曲线出现显著变化,心内膜跟踪的一致性较差。方法C不仅是最准确和可重复的方法,也是最耗时的方法。使用不规则模型心脏模型时,不同的3D容积定量方法在准确性和可重复性方面有显著差异。尽管在长轴视图中轮廓描绘可能看起来最佳,但在圆周方向上可能无法复制,并且在半自动轮廓手动校正后,所得测量结果似乎不太可靠。