• 文献检索
  • 文档翻译
  • 深度研究
  • 学术资讯
  • Suppr Zotero 插件Zotero 插件
  • 邀请有礼
  • 套餐&价格
  • 历史记录
应用&插件
Suppr Zotero 插件Zotero 插件浏览器插件Mac 客户端Windows 客户端微信小程序
定价
高级版会员购买积分包购买API积分包
服务
文献检索文档翻译深度研究API 文档MCP 服务
关于我们
关于 Suppr公司介绍联系我们用户协议隐私条款
关注我们

Suppr 超能文献

核心技术专利:CN118964589B侵权必究
粤ICP备2023148730 号-1Suppr @ 2026

文献检索

告别复杂PubMed语法,用中文像聊天一样搜索,搜遍4000万医学文献。AI智能推荐,让科研检索更轻松。

立即免费搜索

文件翻译

保留排版,准确专业,支持PDF/Word/PPT等文件格式,支持 12+语言互译。

免费翻译文档

深度研究

AI帮你快速写综述,25分钟生成高质量综述,智能提取关键信息,辅助科研写作。

立即免费体验

使用VisANT 5.0可视化微生物群落中的代谢相互作用网络。

Visualization of Metabolic Interaction Networks in Microbial Communities Using VisANT 5.0.

作者信息

Granger Brian R, Chang Yi-Chien, Wang Yan, DeLisi Charles, Segrè Daniel, Hu Zhenjun

机构信息

Bioinformatics Program, Boston University, Boston, Massachusetts, United States of America.

Center for Advanced Genomic Technology, Boston University, Boston, Massachusetts, United States of America.

出版信息

PLoS Comput Biol. 2016 Apr 15;12(4):e1004875. doi: 10.1371/journal.pcbi.1004875. eCollection 2016 Apr.

DOI:10.1371/journal.pcbi.1004875
PMID:27081850
原文链接:https://pmc.ncbi.nlm.nih.gov/articles/PMC4833320/
Abstract

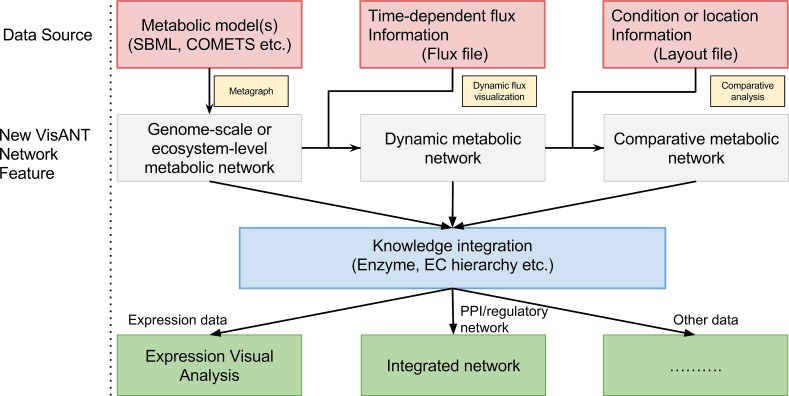
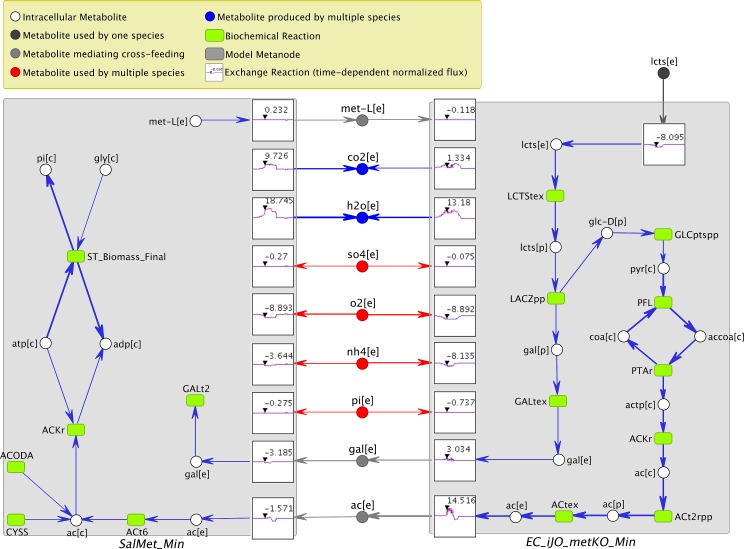
The complexity of metabolic networks in microbial communities poses an unresolved visualization and interpretation challenge. We address this challenge in the newly expanded version of a software tool for the analysis of biological networks, VisANT 5.0. We focus in particular on facilitating the visual exploration of metabolic interaction between microbes in a community, e.g. as predicted by COMETS (Computation of Microbial Ecosystems in Time and Space), a dynamic stoichiometric modeling framework. Using VisANT's unique metagraph implementation, we show how one can use VisANT 5.0 to explore different time-dependent ecosystem-level metabolic networks. In particular, we analyze the metabolic interaction network between two bacteria previously shown to display an obligate cross-feeding interdependency. In addition, we illustrate how a putative minimal gut microbiome community could be represented in our framework, making it possible to highlight interactions across multiple coexisting species. We envisage that the "symbiotic layout" of VisANT can be employed as a general tool for the analysis of metabolism in complex microbial communities as well as heterogeneous human tissues. VisANT is freely available at: http://visant.bu.edu and COMETS at http://comets.bu.edu.

摘要

微生物群落中代谢网络的复杂性带来了一个尚未解决的可视化和解释难题。我们在用于生物网络分析的软件工具VisANT 5.0的最新扩展版本中应对这一挑战。我们特别关注促进对群落中微生物间代谢相互作用的可视化探索,例如由动态化学计量建模框架COMETS(时空微生物生态系统计算)预测的相互作用。利用VisANT独特的元图实现,我们展示了如何使用VisANT 5.0来探索不同的随时间变化的生态系统水平代谢网络。特别是,我们分析了先前显示出专性交叉喂养相互依存关系的两种细菌之间的代谢相互作用网络。此外,我们说明了在我们的框架中如何表示一个假定的最小肠道微生物群落,从而有可能突出多个共存物种之间的相互作用。我们设想,VisANT的“共生布局”可作为分析复杂微生物群落以及异质人体组织中代谢的通用工具。VisANT可在以下网址免费获取:http://visant.bu.edu ,COMETS可在http://comets.bu.edu获取。

https://cdn.ncbi.nlm.nih.gov/pmc/blobs/33ca/4833320/76639bb58528/pcbi.1004875.g003.jpg
https://cdn.ncbi.nlm.nih.gov/pmc/blobs/33ca/4833320/80c1c48d3df1/pcbi.1004875.g001.jpg
https://cdn.ncbi.nlm.nih.gov/pmc/blobs/33ca/4833320/51fa3f8b5bae/pcbi.1004875.g002.jpg
https://cdn.ncbi.nlm.nih.gov/pmc/blobs/33ca/4833320/76639bb58528/pcbi.1004875.g003.jpg
https://cdn.ncbi.nlm.nih.gov/pmc/blobs/33ca/4833320/80c1c48d3df1/pcbi.1004875.g001.jpg
https://cdn.ncbi.nlm.nih.gov/pmc/blobs/33ca/4833320/51fa3f8b5bae/pcbi.1004875.g002.jpg
https://cdn.ncbi.nlm.nih.gov/pmc/blobs/33ca/4833320/76639bb58528/pcbi.1004875.g003.jpg

相似文献

1
Visualization of Metabolic Interaction Networks in Microbial Communities Using VisANT 5.0.使用VisANT 5.0可视化微生物群落中的代谢相互作用网络。
PLoS Comput Biol. 2016 Apr 15;12(4):e1004875. doi: 10.1371/journal.pcbi.1004875. eCollection 2016 Apr.
2
VisANT: an online visualization and analysis tool for biological interaction data.VisANT:一款用于生物相互作用数据的在线可视化与分析工具。
BMC Bioinformatics. 2004 Feb 19;5:17. doi: 10.1186/1471-2105-5-17.
3
VisANT: an integrative framework for networks in systems biology.VisANT:系统生物学中网络的综合框架。
Brief Bioinform. 2008 Jul;9(4):317-25. doi: 10.1093/bib/bbn020. Epub 2008 May 7.
4
VisANT: data-integrating visual framework for biological networks and modules.VisANT:用于生物网络和模块的数据整合可视化框架。
Nucleic Acids Res. 2005 Jul 1;33(Web Server issue):W352-7. doi: 10.1093/nar/gki431.
5
Community flux balance analysis for microbial consortia at balanced growth.微生物群落平衡生长的群落通量平衡分析。
PLoS One. 2013 May 31;8(5):e64567. doi: 10.1371/journal.pone.0064567. Print 2013.
6
VisANT 3.5: multi-scale network visualization, analysis and inference based on the gene ontology.VisANT 3.5:基于基因本体论的多尺度网络可视化、分析与推理
Nucleic Acids Res. 2009 Jul;37(Web Server issue):W115-21. doi: 10.1093/nar/gkp406. Epub 2009 May 21.
7
A metabolic modeling platform for the computation of microbial ecosystems in time and space (COMETS).一个用于在时间和空间上计算微生物生态系统的代谢建模平台(COMETS)。
Nat Protoc. 2021 Nov;16(11):5030-5082. doi: 10.1038/s41596-021-00593-3. Epub 2021 Oct 11.
8
VisANT 3.0: new modules for pathway visualization, editing, prediction and construction.VisANT 3.0:用于通路可视化、编辑、预测和构建的新模块。
Nucleic Acids Res. 2007 Jul;35(Web Server issue):W625-32. doi: 10.1093/nar/gkm295. Epub 2007 Jun 22.
9
Using VisANT to Analyze Networks.使用VisANT分析网络。
Curr Protoc Bioinformatics. 2014;45(88):8.8.1-39. doi: 10.1002/0471250953.bi0808s45.
10
Analysis strategy of protein-protein interaction networks.蛋白质-蛋白质相互作用网络的分析策略
Methods Mol Biol. 2013;939:141-81. doi: 10.1007/978-1-62703-107-3_11.

引用本文的文献

1
Exploring interspecific interaction variability in microbiota: A review.探索微生物群中的种间相互作用变异性:综述
Eng Microbiol. 2024 Nov 9;4(4):100178. doi: 10.1016/j.engmic.2024.100178. eCollection 2024 Dec.
2
BioNexusSentinel: a visual tool for bioregulatory network and cytohistological RNA-seq genetic expression profiling within the context of multicellular simulation research using ChatGPT-augmented software engineering.生物枢纽哨兵:一种在使用ChatGPT增强软件工程的多细胞模拟研究背景下,用于生物调节网络和细胞组织学RNA测序基因表达谱分析的可视化工具。
Bioinform Adv. 2024 Mar 20;4(1):vbae046. doi: 10.1093/bioadv/vbae046. eCollection 2024.
3

本文引用的文献

1
Synthetic Ecology of Microbes: Mathematical Models and Applications.微生物合成生态学:数学模型与应用
J Mol Biol. 2016 Feb 27;428(5 Pt B):837-61. doi: 10.1016/j.jmb.2015.10.019. Epub 2015 Nov 11.
2
Calibration and analysis of genome-based models for microbial ecology.基于基因组的微生物生态学模型的校准与分析。
Elife. 2015 Oct 16;4:e08208. doi: 10.7554/eLife.08208.
3
Modeling cancer metabolism on a genome scale.在基因组规模上模拟癌症代谢。
Molecular landscapes of glioblastoma cell lines revealed a group of patients that do not benefit from tumor suppressor expression.
胶质母细胞瘤细胞系的分子图谱揭示了一组无法从肿瘤抑制因子表达中获益的患者。
Front Neurosci. 2023 Sep 15;17:1260409. doi: 10.3389/fnins.2023.1260409. eCollection 2023.
4
Unravelling potential biomarkers for acute and chronic brucellosis through proteomic and bioinformatic approaches.通过蛋白质组学和生物信息学方法揭示急性和慢性布氏菌病的潜在生物标志物。
Front Cell Infect Microbiol. 2023 Jul 13;13:1216176. doi: 10.3389/fcimb.2023.1216176. eCollection 2023.
5
CAVE: a cloud-based platform for analysis and visualization of metabolic pathways.CAVE:一个基于云的代谢通路分析和可视化平台。
Nucleic Acids Res. 2023 Jul 5;51(W1):W70-W77. doi: 10.1093/nar/gkad360.
6
NetCom: A Network-Based Tool for Predicting Metabolic Activities of Microbial Communities Based on Interpretation of Metagenomics Data.NetCom:一种基于宏基因组学数据解读来预测微生物群落代谢活性的网络工具。
Microorganisms. 2021 Aug 30;9(9):1838. doi: 10.3390/microorganisms9091838.
7
Metabolic modelling approaches for describing and engineering microbial communities.用于描述和构建微生物群落的代谢建模方法。
Comput Struct Biotechnol J. 2020 Dec 15;19:226-246. doi: 10.1016/j.csbj.2020.12.003. eCollection 2021.
8
Trem2 promotes anti-inflammatory responses in microglia and is suppressed under pro-inflammatory conditions.Trem2 促进小胶质细胞的抗炎反应,并在促炎条件下受到抑制。
Hum Mol Genet. 2020 Nov 25;29(19):3224-3248. doi: 10.1093/hmg/ddaa209.
9
Regularized S-Map Reveals Varying Bacterial Interactions.正则化 S-Map 揭示了不同的细菌相互作用。
Appl Environ Microbiol. 2020 Oct 1;86(20). doi: 10.1128/AEM.01615-20.
10
Metabolomics as an Emerging Tool in the Search for Astrobiologically Relevant Biomarkers.代谢组学作为寻找具有天体生物学相关性生物标志物的新兴工具。
Astrobiology. 2020 Oct;20(10):1251-1261. doi: 10.1089/ast.2019.2135. Epub 2020 Jun 17.
Mol Syst Biol. 2015 Jun 30;11(6):817. doi: 10.15252/msb.20145307.
4
Spatially-resolved metabolic cooperativity within dense bacterial colonies.密集细菌菌落内的空间分辨代谢协同作用。
BMC Syst Biol. 2015 Mar 18;9:15. doi: 10.1186/s12918-015-0155-1.
5
Using VisANT to Analyze Networks.使用VisANT分析网络。
Curr Protoc Bioinformatics. 2014;45(88):8.8.1-39. doi: 10.1002/0471250953.bi0808s45.
6
The Earth Microbiome project: successes and aspirations.地球微生物组计划:成就与愿景。
BMC Biol. 2014 Aug 22;12:69. doi: 10.1186/s12915-014-0069-1.
7
Metabolic resource allocation in individual microbes determines ecosystem interactions and spatial dynamics.单个微生物中的代谢资源分配决定了生态系统的相互作用和空间动态。
Cell Rep. 2014 May 22;7(4):1104-15. doi: 10.1016/j.celrep.2014.03.070. Epub 2014 May 1.
8
MetDraw: automated visualization of genome-scale metabolic network reconstructions and high-throughput data.MetDraw:基因组尺度代谢网络重建和高通量数据的自动化可视化。
Bioinformatics. 2014 May 1;30(9):1327-8. doi: 10.1093/bioinformatics/btt758. Epub 2014 Jan 9.
9
The MetaCyc database of metabolic pathways and enzymes and the BioCyc collection of Pathway/Genome Databases.MetaCyc 数据库包含代谢途径和酶,以及 BioCyc 集合的途径/基因组数据库。
Nucleic Acids Res. 2014 Jan;42(Database issue):D459-71. doi: 10.1093/nar/gkt1103. Epub 2013 Nov 12.
10
Data, information, knowledge and principle: back to metabolism in KEGG.数据、信息、知识和原理:回到 KEGG 的代谢途径中。
Nucleic Acids Res. 2014 Jan;42(Database issue):D199-205. doi: 10.1093/nar/gkt1076. Epub 2013 Nov 7.