Biggerstaff Matthew, Alper David, Dredze Mark, Fox Spencer, Fung Isaac Chun-Hai, Hickmann Kyle S, Lewis Bryan, Rosenfeld Roni, Shaman Jeffrey, Tsou Ming-Hsiang, Velardi Paola, Vespignani Alessandro, Finelli Lyn
Epidemiology and Prevention Branch, Influenza Division, Centers for Disease Control and Prevention, Atlanta, Georgia, USA.
Everyday Health, New York, New York, USA.
BMC Infect Dis. 2016 Jul 22;16:357. doi: 10.1186/s12879-016-1669-x.
Early insights into the timing of the start, peak, and intensity of the influenza season could be useful in planning influenza prevention and control activities. To encourage development and innovation in influenza forecasting, the Centers for Disease Control and Prevention (CDC) organized a challenge to predict the 2013-14 Unites States influenza season.
Challenge contestants were asked to forecast the start, peak, and intensity of the 2013-2014 influenza season at the national level and at any or all Health and Human Services (HHS) region level(s). The challenge ran from December 1, 2013-March 27, 2014; contestants were required to submit 9 biweekly forecasts at the national level to be eligible. The selection of the winner was based on expert evaluation of the methodology used to make the prediction and the accuracy of the prediction as judged against the U.S. Outpatient Influenza-like Illness Surveillance Network (ILINet).
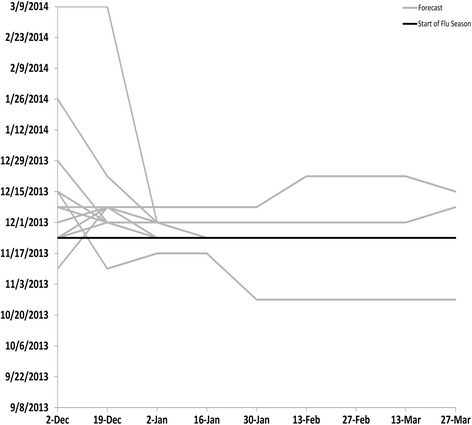
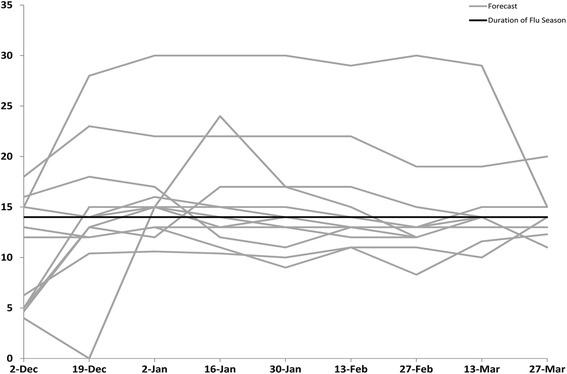
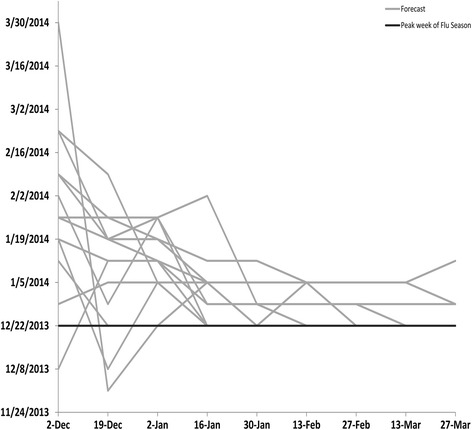
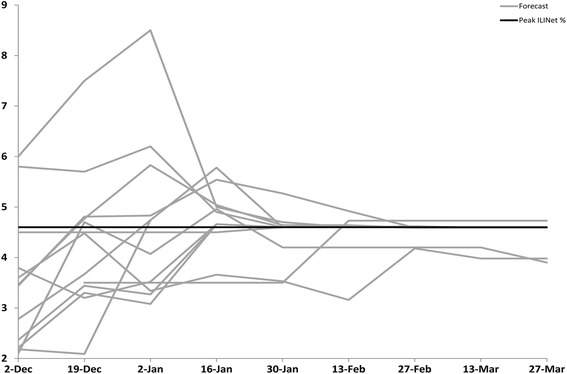
Nine teams submitted 13 forecasts for all required milestones. The first forecast was due on December 2, 2013; 3/13 forecasts received correctly predicted the start of the influenza season within one week, 1/13 predicted the peak within 1 week, 3/13 predicted the peak ILINet percentage within 1 %, and 4/13 predicted the season duration within 1 week. For the prediction due on December 19, 2013, the number of forecasts that correctly forecasted the peak week increased to 2/13, the peak percentage to 6/13, and the duration of the season to 6/13. As the season progressed, the forecasts became more stable and were closer to the season milestones.
Forecasting has become technically feasible, but further efforts are needed to improve forecast accuracy so that policy makers can reliably use these predictions. CDC and challenge contestants plan to build upon the methods developed during this contest to improve the accuracy of influenza forecasts.
尽早了解流感季节开始、高峰期和强度的时间,可能有助于规划流感预防和控制活动。为鼓励流感预测方面的发展和创新,美国疾病控制与预防中心(CDC)组织了一项预测2013 - 2014年美国流感季节的挑战赛。
要求参赛选手预测2013 - 2014年流感季节在国家层面以及任何一个或所有卫生与公众服务部(HHS)地区层面的开始时间、高峰期和强度。挑战赛从2013年12月1日持续到2014年3月27日;参赛选手需要在国家层面提交9份每两周一次的预测才有资格参赛。获胜者的评选基于对用于进行预测的方法的专家评估以及与美国门诊流感样疾病监测网络(ILINet)相比预测的准确性。
9个团队提交了针对所有所需时间节点的13份预测。第一份预测应于2013年12月2日提交;13份预测中有3份正确预测流感季节开始时间在一周内,1/13预测高峰期在1周内,3/13预测高峰期ILINet百分比在1%以内,4/13预测季节持续时间在1周内。对于2013年12月19日应提交的预测,正确预测高峰期所在周的预测数量增至2/13,预测高峰期百分比的增至6/13,预测季节持续时间的增至6/13。随着季节的推进,预测变得更加稳定且更接近季节时间节点。
预测在技术上已可行,但仍需进一步努力提高预测准确性,以便政策制定者能够可靠地使用这些预测。CDC和参赛选手计划基于本次竞赛中开发的方法来提高流感预测的准确性。