Jay Jeremy J, Brouwer Cory
Bioinformatics Services Division, North Carolina Research Campus, Kannapolis, North Carolina, United States of America.
Bioinformatics and Genomics Department, University of North Carolina at Charlotte, Charlotte, North Carolina, United States of America.
PLoS One. 2016 Aug 4;11(8):e0160519. doi: 10.1371/journal.pone.0160519. eCollection 2016.
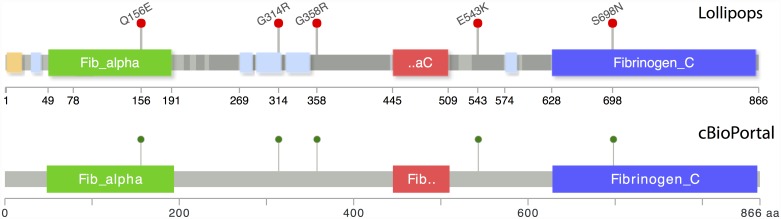
Concise visualization is critical to present large amounts of information in a minimal space that can be interpreted quickly. Clinical applications in precision medicine present an important use case due to the time dependent nature of the interpretations, although visualization is increasingly necessary across the life sciences. In this paper we describe the Lollipops software for the presentation of panel or exome sequencing results. Source code and binaries are freely available at https://github.com/pbnjay/lollipops. Although other software and web resources exist to produce lollipop diagrams, these packages are less suited to clinical applications. The demands of precision medicine require the ability to easily fit into a workflow and incorporate external information without manual intervention.
The Lollipops software provides a simple command line interface that only requires an official gene symbol and mutation list making it easily scriptable. External information is integrated using the publicly available Uniprot and Pfam resources. Heuristics are used to select the most informative components and condense them for a concise plot. The output is a flexible Scalable Vector Graphic (SVG) diagram that can be displayed in a web page or graphic illustration tool.
The Lollipops software creates information-dense, publication-quality mutation plots for automated pipelines and high-throughput workflows in precision medicine. The automatic data integration enables clinical data security, and visualization heuristics concisely present knowledge with minimal user configuration.
简洁的可视化对于在最小空间内呈现大量可快速解读的信息至关重要。由于解读具有时间依赖性,精准医学中的临床应用是一个重要的用例,尽管可视化在生命科学领域日益必要。在本文中,我们描述了用于展示面板或外显子组测序结果的棒棒糖软件。源代码和二进制文件可在https://github.com/pbnjay/lollipops上免费获取。虽然存在其他软件和网络资源来生成棒棒糖图,但这些软件包不太适合临床应用。精准医学的需求要求能够轻松融入工作流程并整合外部信息而无需人工干预。
棒棒糖软件提供了一个简单的命令行界面,只需要官方基因符号和突变列表,使其易于编写脚本。使用公开可用的UniProt和Pfam资源整合外部信息。使用启发式方法选择最具信息性的组件并将其浓缩以生成简洁的图表。输出是一个灵活的可缩放矢量图形(SVG)图,可以在网页或图形说明工具中显示。
棒棒糖软件为精准医学中的自动化流程和高通量工作流程创建了信息密集、符合出版质量的突变图。自动数据整合确保了临床数据安全,可视化启发式方法以最少的用户配置简洁地呈现知识。