Lee Sang-Yoon, Lee Eun Kyoung, Park Ki Ho, Kim Dong Myung, Jeoung Jin Wook
Department of Ophthalmology, Seoul National University College of Medicine, Seoul, South Korea.
Department of Ophthalmology, Jeju National University Hospital, Jeju-si, South Korea.
PLoS One. 2016 Oct 20;11(10):e0164866. doi: 10.1371/journal.pone.0164866. eCollection 2016.
To report an asymmetry analysis of macular inner retinal layers using swept-source optical coherence tomography (OCT) and to evaluate the utility for glaucoma diagnosis.
Observational, cross-sectional study.
Seventy normal healthy subjects and 62 glaucoma patients.
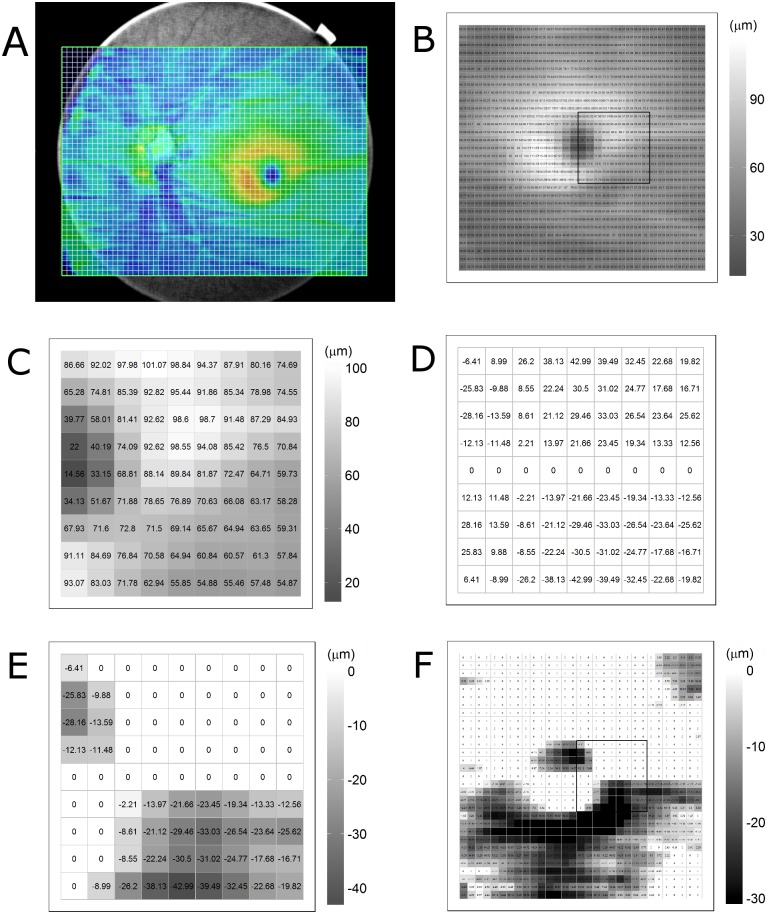
Three-dimensional scans were acquired from 70 normal subjects and 62 open angle glaucoma patients by swept-source OCT. The thickness of the retinal nerve fiber layer, ganglion cell-inner plexiform layer (GCIPL), ganglion cell complex, and total retina were calculated within a 6.2×6.2 mm macular area divided into a 31×31 grid of 200×200 μm superpixels. For each of the corresponding superpixels, the thickness differences between the subject eyes and contra-lateral eyes and between the upper and lower macula halves of the subject eyes were determined. The negative differences were displayed on a gray-scale asymmetry map. Black superpixels were defined as thickness decreases over the cut-off values.
The negative inter-ocular and inter-hemisphere differences in GCIPL thickness (mean ± standard deviation) were -2.78 ± 0.97 μm and -3.43 ± 0.71 μm in the normal group and -4.26 ± 2.23 μm and -4.88 ± 1.46 μm in the glaucoma group. The overall extent of the four layers' thickness decrease was larger in the glaucoma group than in the normal group (all Ps<0.05). The numbers of black superpixels on all of the asymmetry maps were larger in the glaucoma group than in the normal group (all Ps<0.05). The area under receiver operating characteristic curves of average negative thickness differences in macular inner layers for glaucoma diagnosis ranged from 0.748 to 0.894.
The asymmetry analysis of macular inner retinal layers showed significant differences between the normal and glaucoma groups. The diagnostic performance of the asymmetry analysis was comparable to that of previous methods. These findings suggest that the asymmetry analysis can be a potential ancillary diagnostic tool.
报告使用扫频光学相干断层扫描(OCT)对黄斑内层视网膜进行的不对称性分析,并评估其在青光眼诊断中的效用。
观察性横断面研究。
70名正常健康受试者和62名青光眼患者。
通过扫频OCT对70名正常受试者和62名开角型青光眼患者进行三维扫描。在一个6.2×6.2mm的黄斑区域内计算视网膜神经纤维层、神经节细胞-内丛状层(GCIPL)、神经节细胞复合体和整个视网膜的厚度,该区域被划分为一个31×31的网格,每个超像素为200×200μm。对于每个相应的超像素,确定受试者双眼与对侧眼之间以及受试者双眼黄斑上下半部分之间的厚度差异。负差异显示在灰度不对称图上。黑色超像素定义为厚度低于临界值。
正常组GCIPL厚度的眼间和半球间负差异(均值±标准差)分别为-2.78±0.97μm和-3.43±0.71μm,青光眼组分别为-4.26±2.23μm和-4.88±1.46μm。青光眼组四层厚度降低的总体程度大于正常组(所有P<0.05)。青光眼组所有不对称图上黑色超像素的数量均多于正常组(所有P<0.05)。用于青光眼诊断的黄斑内层平均负厚度差异的受试者操作特征曲线下面积范围为0.748至0.894。
黄斑内层视网膜的不对称性分析显示正常组和青光眼组之间存在显著差异。不对称性分析的诊断性能与先前方法相当。这些发现表明,不对称性分析可能是一种潜在的辅助诊断工具。