• 文献检索
  • 文档翻译
  • 深度研究
  • 学术资讯
  • Suppr Zotero 插件Zotero 插件
  • 邀请有礼
  • 套餐&价格
  • 历史记录
应用&插件
Suppr Zotero 插件Zotero 插件浏览器插件Mac 客户端Windows 客户端微信小程序
定价
高级版会员购买积分包购买API积分包
服务
文献检索文档翻译深度研究API 文档MCP 服务
关于我们
关于 Suppr公司介绍联系我们用户协议隐私条款
关注我们

Suppr 超能文献

核心技术专利:CN118964589B侵权必究
粤ICP备2023148730 号-1Suppr @ 2026

文献检索

告别复杂PubMed语法,用中文像聊天一样搜索,搜遍4000万医学文献。AI智能推荐,让科研检索更轻松。

立即免费搜索

文件翻译

保留排版,准确专业,支持PDF/Word/PPT等文件格式,支持 12+语言互译。

免费翻译文档

深度研究

AI帮你快速写综述,25分钟生成高质量综述,智能提取关键信息,辅助科研写作。

立即免费体验

构建质量指标漏斗图指南:以重症监护病房患者死亡率为例的研究。

Guidelines on constructing funnel plots for quality indicators: A case study on mortality in intensive care unit patients.

机构信息

1 Academic Medical Center, University of Amsterdam, Department of Medical Informatics, Amsterdam Public Health Research Institute, Amsterdam, The Netherlands.

2 Dutch National Intensive Care Registry (NICE), Amsterdam, The Netherlands.

出版信息

Stat Methods Med Res. 2018 Nov;27(11):3350-3366. doi: 10.1177/0962280217700169. Epub 2017 Mar 23.

DOI:10.1177/0962280217700169
PMID:28330409
原文链接:https://pmc.ncbi.nlm.nih.gov/articles/PMC6193208/
Abstract

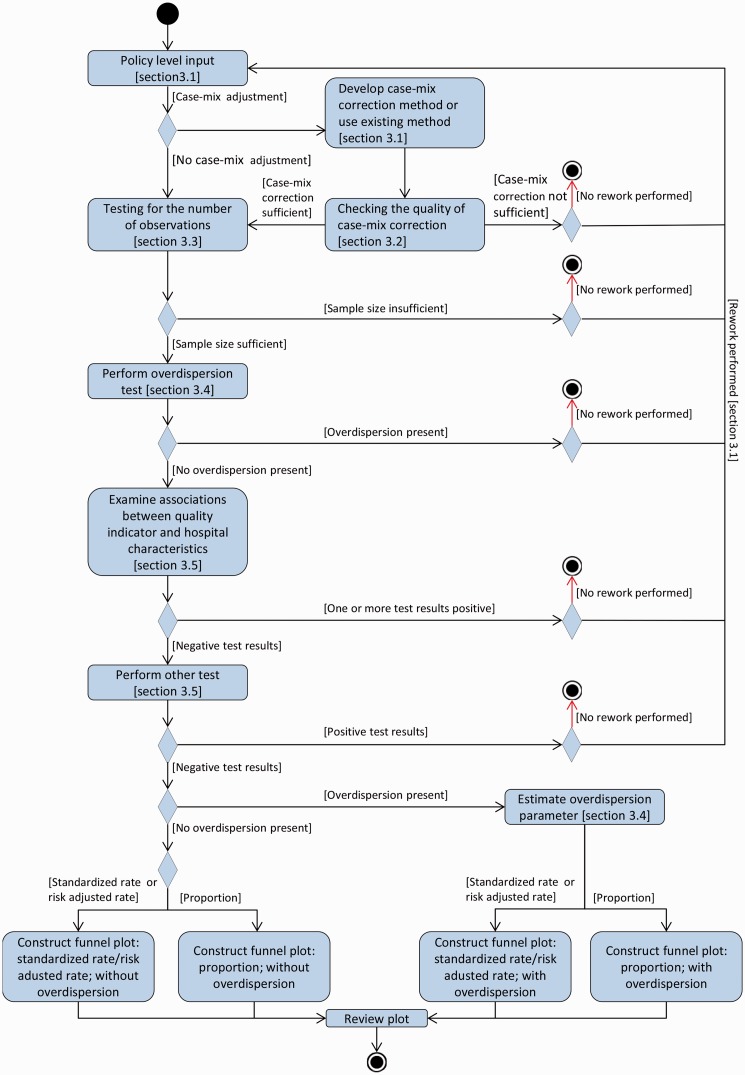
Funnel plots are graphical tools to assess and compare clinical performance of a group of care professionals or care institutions on a quality indicator against a benchmark. Incorrect construction of funnel plots may lead to erroneous assessment and incorrect decisions potentially with severe consequences. We provide workflow-based guidance for data analysts on constructing funnel plots for the evaluation of binary quality indicators, expressed as proportions, risk-adjusted rates or standardised rates. Our guidelines assume the following steps: (1) defining policy level input; (2) checking the quality of models used for case-mix correction; (3) examining whether the number of observations per hospital is sufficient; (4) testing for overdispersion of the values of the quality indicator; (5) testing whether the values of quality indicators are associated with institutional characteristics; and (6) specifying how the funnel plot should be constructed. We illustrate our guidelines using data from the Dutch National Intensive Care Evaluation registry. We expect that our guidelines will be useful to data analysts preparing funnel plots and to registries, or other organisations publishing quality indicators. This is particularly true if these people and organisations wish to use standard operating procedures when constructing funnel plots, perhaps to comply with the demands of certification.

摘要

漏斗图是一种图形工具,用于评估和比较一组医疗保健专业人员或医疗机构在质量指标上的临床表现与基准。漏斗图的构建不正确可能导致错误的评估和错误的决策,可能会产生严重的后果。我们为数据分析师提供了针对二进制质量指标(表示为比例、风险调整率或标准化率)评估构建漏斗图的基于工作流程的指导。我们的指南假设以下步骤:(1)定义政策水平输入;(2)检查用于病例组合校正的模型的质量;(3)检查每个医院的观察数量是否足够;(4)测试质量指标值的过分散性;(5)测试质量指标值是否与机构特征相关;(6)指定如何构建漏斗图。我们使用荷兰国家重症监护评估登记处的数据来说明我们的指南。我们希望我们的指南对准备漏斗图的数据分析师以及发布质量指标的登记处或其他组织有用。如果这些人和组织希望在构建漏斗图时使用标准操作程序,也许是为了遵守认证的要求,那么这尤其如此。

https://cdn.ncbi.nlm.nih.gov/pmc/blobs/7d12/6193208/c9c0692719d9/10.1177_0962280217700169-fig4.jpg
https://cdn.ncbi.nlm.nih.gov/pmc/blobs/7d12/6193208/0468f09c586b/10.1177_0962280217700169-fig1.jpg
https://cdn.ncbi.nlm.nih.gov/pmc/blobs/7d12/6193208/feafac4a7e46/10.1177_0962280217700169-fig2.jpg
https://cdn.ncbi.nlm.nih.gov/pmc/blobs/7d12/6193208/726649d2e979/10.1177_0962280217700169-fig3.jpg
https://cdn.ncbi.nlm.nih.gov/pmc/blobs/7d12/6193208/c9c0692719d9/10.1177_0962280217700169-fig4.jpg

相似文献

1
Guidelines on constructing funnel plots for quality indicators: A case study on mortality in intensive care unit patients.构建质量指标漏斗图指南:以重症监护病房患者死亡率为例的研究。
Stat Methods Med Res. 2018 Nov;27(11):3350-3366. doi: 10.1177/0962280217700169. Epub 2017 Mar 23.
2
Funnel plots for comparing performance of PCI performing hospitals and cardiologists: demonstration of utility using the New York hospital mortality data.用于比较实施经皮冠状动脉介入治疗(PCI)的医院和心脏病专家表现的漏斗图:利用纽约医院死亡率数据进行效用演示。
Catheter Cardiovasc Interv. 2009 Apr 1;73(5):589-94. doi: 10.1002/ccd.21893.
3
Funnel plots of patient-reported outcomes to evaluate health-care quality: Basic principles, pitfalls and considerations.漏斗图评估医疗保健质量的患者报告结局:基本原则、陷阱和注意事项。
Nephrology (Carlton). 2021 Feb;26(2):95-104. doi: 10.1111/nep.13761. Epub 2020 Oct 1.
4
Quality Indicators of End-of-Life Care in Patients With Cancer: What Rate Is Right?癌症患者临终关怀的质量指标:何种比率才合适?
J Oncol Pract. 2015 May;11(3):e279-87. doi: 10.1200/JOP.2015.004416. Epub 2015 Apr 28.
5
Graphical augmentations to sample-size-based funnel plot in meta-analysis.基于样本量的漏斗图在荟萃分析中的图形增强。
Res Synth Methods. 2019 Sep;10(3):376-388. doi: 10.1002/jrsm.1340. Epub 2019 Feb 7.
6
Why try to predict ICU outcomes?为什么要尝试预测重症监护病房的治疗结果?
Curr Opin Crit Care. 2014 Oct;20(5):544-9. doi: 10.1097/MCC.0000000000000136.
7
[Comparative quality measurements part 3: funnel plots].[比较质量测量第3部分:漏斗图]
Pflege. 2014 Feb;27(1):41-9. doi: 10.1024/1012-5302/a000338.
8
Reliability of in-hospital mortality as a quality indicator in clinical quality registries. A case study in an intensive care quality register.住院死亡率作为临床质量登记中质量指标的可靠性。一项重症监护质量登记的案例研究。
Methods Inf Med. 2013;52(5):432-40. doi: 10.3414/ME12-02-0070. Epub 2013 Jun 28.
9
[Funnel plots for comparing pressure ulcer and fall rates in 76 nursing homes].[用于比较76家养老院中压疮发生率和跌倒发生率的漏斗图]
Gesundheitswesen. 2011 Jun;73(6):e98-e102. doi: 10.1055/s-0030-1254167. Epub 2010 Jun 11.
10
Funnel plots and their emerging application in surgery.漏斗图及其在外科手术中的新兴应用。
Ann Surg. 2009 Mar;249(3):376-83. doi: 10.1097/SLA.0b013e31819a47b1.

引用本文的文献

1
Using the Observational Medical Outcomes Partnership Common Data Model for a multi-registry intensive care unit benchmarking federated analysis: lessons learned.使用观察性医疗结果合作组织通用数据模型进行多注册重症监护病房基准联合分析:经验教训。
JAMIA Open. 2025 Jul 22;8(4):ooaf052. doi: 10.1093/jamiaopen/ooaf052. eCollection 2025 Aug.
2
Initial management of newly diagnosed WHO grade 2-3 adult meningioma following surgery: results from the Dutch Brain Tumour Registry (2016-2021).新诊断的WHO 2-3级成人脑膜瘤术后的初始管理:来自荷兰脑肿瘤登记处(2016-2021年)的结果
J Neurooncol. 2024 Oct;170(1):41-52. doi: 10.1007/s11060-024-04730-2. Epub 2024 Aug 29.
3

本文引用的文献

1
A calibration hierarchy for risk models was defined: from utopia to empirical data.定义了风险模型的校准层次结构:从理想状态到经验数据。
J Clin Epidemiol. 2016 Jun;74:167-76. doi: 10.1016/j.jclinepi.2015.12.005. Epub 2016 Jan 6.
2
Individual and Clustered Rankability of ICUs According to Case-Mix-Adjusted Mortality.根据病例组合调整死亡率对重症监护病房进行个体和聚类可排名性分析。
Crit Care Med. 2016 May;44(5):901-9. doi: 10.1097/CCM.0000000000001521.
3
Data Resource Profile: the Dutch National Intensive Care Evaluation (NICE) Registry of Admissions to Adult Intensive Care Units.
Optimizing Hospital Performance Evaluation in Total Weight Loss Outcomes After Bariatric Surgery: A Retrospective Analysis to Guide Further Improvement in Dutch Hospitals.
优化减重手术后总体减重效果的医院绩效评估:一项回顾性分析,旨在指导荷兰医院进一步改进。
Obes Surg. 2024 Aug;34(8):2820-2827. doi: 10.1007/s11695-024-07195-4. Epub 2024 Jul 9.
4
Test-specific funnel plots for healthcare provider profiling leveraging individual- and summary-level information.利用个体层面和汇总层面信息进行医疗服务提供者概况分析的特定测试漏斗图。
Health Serv Outcomes Res Methodol. 2023 Mar;23:45-58. doi: 10.1007/s10742-022-00285-9. Epub 2022 Jul 6.
5
Evaluations of statistical methods for outlier detection when benchmarking in clinical registries: a systematic review.临床注册研究中离群值检测的统计方法评估:系统评价。
BMJ Open. 2023 Jul 14;13(7):e069130. doi: 10.1136/bmjopen-2022-069130.
6
Outcome following unplanned critical care admission after lung resection.肺切除术后非计划重症监护病房入院后的结局
JTCVS Open. 2022 Jan 25;9:281-290. doi: 10.1016/j.xjon.2022.01.018. eCollection 2022 Mar.
7
Healthcare provider profiling: fixing observation period or fixing sample size?医疗服务提供者概况分析:确定观察期还是确定样本量?
BMJ Open Qual. 2022 Apr;11(2). doi: 10.1136/bmjoq-2021-001588.
8
Benchmarking survival outcomes: A funnel plot for survival data.生存结局的基准测试:生存数据的漏斗图。
Stat Methods Med Res. 2022 Jun;31(6):1171-1183. doi: 10.1177/09622802221084130. Epub 2022 Mar 8.
9
Using data linkage for national surveillance of clinical quality indicators for dementia care among Australian aged care users.利用数据链接对澳大利亚老年护理用户的痴呆症护理临床质量指标进行国家监测。
Sci Rep. 2021 May 21;11(1):10674. doi: 10.1038/s41598-021-89646-x.
10
Meta-Analysis of Dyslipidemia Management for the Prevention of Ischemic Stroke Recurrence in China.中国血脂异常管理预防缺血性脑卒中复发的Meta分析
Front Neurol. 2020 Nov 19;11:483570. doi: 10.3389/fneur.2020.483570. eCollection 2020.
数据资源简介:荷兰成人重症监护病房入院情况国家重症监护评估(NICE)登记处
Int J Epidemiol. 2015 Dec;44(6):1850-1850h. doi: 10.1093/ije/dyv291. Epub 2015 Nov 27.
4
Community-acquired pneumonia (CAP) hospitalizations and deaths: is there a role for quality improvement through inter-hospital comparisons?社区获得性肺炎(CAP)的住院治疗与死亡情况:通过医院间比较来改善医疗质量是否可行?
Int J Qual Health Care. 2016 Feb;28(1):22-32. doi: 10.1093/intqhc/mzv092. Epub 2015 Nov 20.
5
Comparison of regression methods for modeling intensive care length of stay.用于重症监护住院时长建模的回归方法比较
PLoS One. 2014 Oct 31;9(10):e109684. doi: 10.1371/journal.pone.0109684. eCollection 2014.
6
Is benchmarking possible in audit of early outcomes after operations for head and neck cancer?对头颈部癌症手术后早期结果进行审计时,是否可以进行基准测试?
Br J Oral Maxillofac Surg. 2014 Dec;52(10):913-21. doi: 10.1016/j.bjoms.2014.08.020. Epub 2014 Sep 15.
7
The pros and cons of funnel plots as an aid to risk communication and patient decision making.
Br J Psychol. 2015 May;106(2):327-48. doi: 10.1111/bjop.12081. Epub 2014 Aug 14.
8
The Hartung-Knapp-Sidik-Jonkman method for random effects meta-analysis is straightforward and considerably outperforms the standard DerSimonian-Laird method.哈特ung-knapp-sidik-jonkman 方法进行随机效应荟萃分析是直接的,并且明显优于标准的德西蒙迪安-莱尔方法。
BMC Med Res Methodol. 2014 Feb 18;14:25. doi: 10.1186/1471-2288-14-25.
9
What is the probability of detecting poorly performing hospitals using funnel plots?使用漏斗图检测表现不佳的医院的概率是多少?
BMJ Qual Saf. 2013 Oct;22(10):870-6. doi: 10.1136/bmjqs-2012-001689. Epub 2013 Jul 5.
10
The relationship between the C-statistic of a risk-adjustment model and the accuracy of hospital report cards: a Monte Carlo Study.风险调整模型的 C 统计量与医院报告卡准确性之间的关系:一项蒙特卡罗研究。
Med Care. 2013 Mar;51(3):275-84. doi: 10.1097/MLR.0b013e31827ff0dc.