Zheng Miaobing, Rangan Anna, Meertens Beth, Wu Jason H Y
The George Institute for Global Health, Faculty of Medicine, University of New South Wales, Sydney 2042, Australia.
Charles Perkins Centre, School of Life and Environmental Sciences, University of Sydney, Sydney 2006, Australia.
Nutrients. 2017 Jun 6;9(6):577. doi: 10.3390/nu9060577.
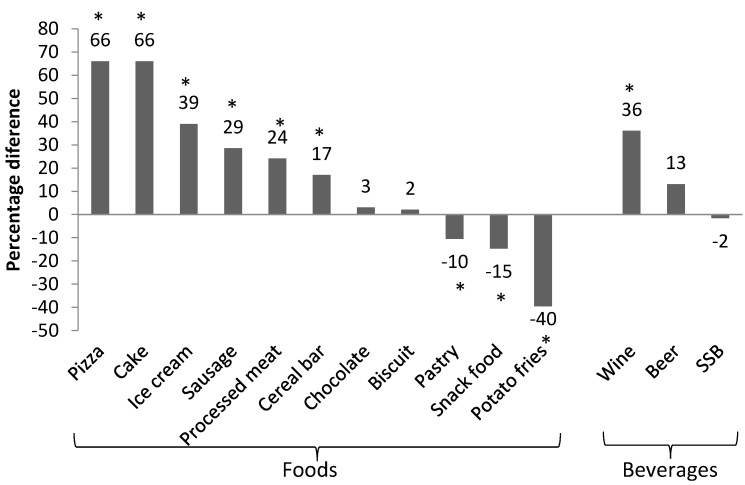
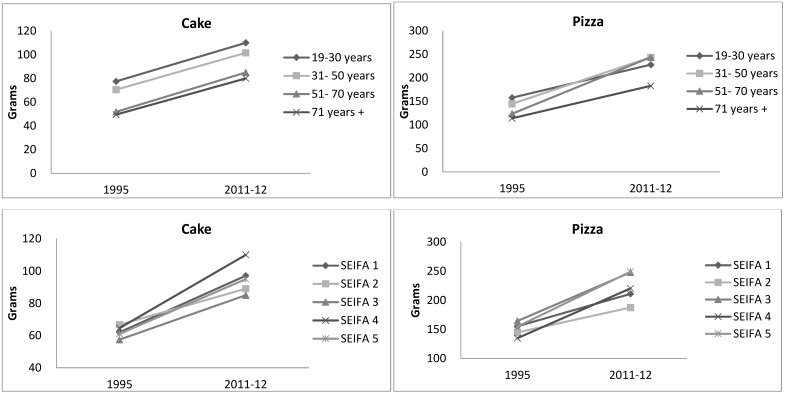
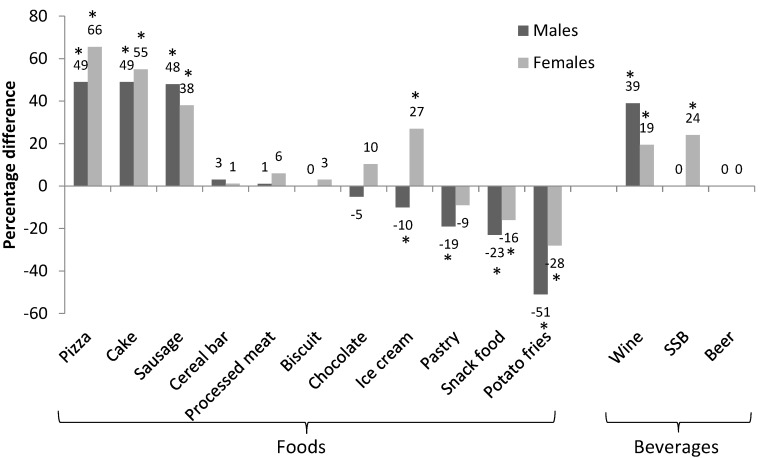
This study aimed to examine the changes in typical portion sizes of commonly consumed discretionary foods among Australian adults from 1995 to 2011-2012. Data of adults (age ≥19 years) from the 1995 Australian National Nutrition Survey and 2011-2012 National Nutrition and Physical Activity Survey were used. Typical portion sizes (median portion) of fourteen discretionary foods that contributed the most to energy intake were determined. Ten out of fourteen food categories demonstrated a significant change in kJ per typical portion from 1995 to 2011-2012 ( ≤ 0.001). kJ per typical portion increased for pizza, cake, sausage, cereal bar, processed meat, ice cream and wine, with pizza and cake demonstrating the largest increases (+570 kJ and +950 kJ in 2011-2012, respectively; both +66% above 1995). In contrast, kJ per typical portion of pastry, snack food and potato fries decreased by 10-40% over time, and did not change for biscuit, chocolate, sugar-sweetened beverage and beer. Similar changes were observed for grams per typical portion consumed. Temporal trends in typical portion sizes were similar according to age group, gender and socioeconomic status. The findings suggest that population-wide strategies that enable consumers to choose smaller portions of discretionary foods are needed to reduce the excess consumption of these products.
本研究旨在调查1995年至2011 - 2012年期间澳大利亚成年人常用的可自由支配食品的典型份量变化情况。研究使用了1995年澳大利亚全国营养调查以及2011 - 2012年全国营养与身体活动调查中成年人(年龄≥19岁)的数据。确定了对能量摄入贡献最大的14种可自由支配食品的典型份量(中位数份量)。从1995年到2011 - 2012年,14种食品类别中有10种食品的每份典型份量的千焦含量出现了显著变化(≤0.001)。披萨、蛋糕、香肠、谷物棒、加工肉类、冰淇淋和葡萄酒的每份典型份量的千焦含量增加,其中披萨和蛋糕的增幅最大(2011 - 2012年分别增加570千焦和950千焦;均比1995年高出66%)。相比之下,随着时间的推移,糕点、休闲食品和薯条的每份典型份量的千焦含量下降了10 - 40%,饼干、巧克力、含糖饮料和啤酒的则没有变化。每份典型份量的克数也出现了类似变化。不同年龄组、性别和社会经济地位的典型份量的时间趋势相似。研究结果表明,需要制定面向全体人群的策略,使消费者能够选择更小份量的可自由支配食品,以减少这些产品的过量消费。