Department of Biomedical Informatics, Harvard Medical School, Boston, MA 02115, USA.
SCI Institute, School of Computing, University of Utah, Salt Lake City, UT 84112, USA.
Bioinformatics. 2017 Sep 15;33(18):2938-2940. doi: 10.1093/bioinformatics/btx364.
Venn and Euler diagrams are a popular yet inadequate solution for quantitative visualization of set intersections. A scalable alternative to Venn and Euler diagrams for visualizing intersecting sets and their properties is needed.
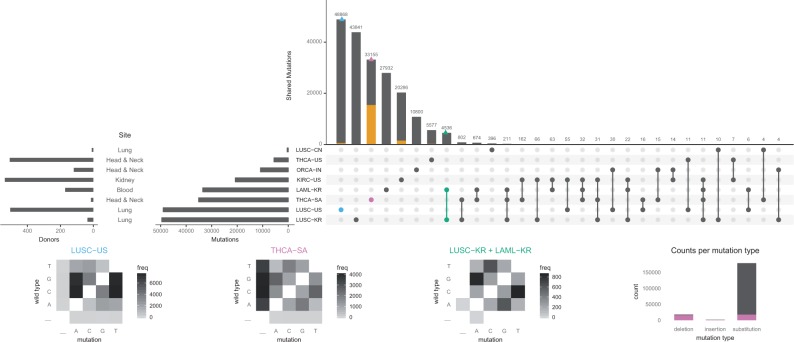
We developed UpSetR, an open source R package that employs a scalable matrix-based visualization to show intersections of sets, their size, and other properties.
UpSetR is available at https://github.com/hms-dbmi/UpSetR/ and released under the MIT License. A Shiny app is available at https://gehlenborglab.shinyapps.io/upsetr/ .
Supplementary data are available at Bioinformatics online.
Venn 和 Euler 图是一种流行但不够完善的解决方案,用于对集合交集进行定量可视化。需要一种可扩展的替代 Venn 和 Euler 图的方法,用于可视化相交的集合及其属性。
我们开发了 UpSetR,这是一个开源的 R 包,它采用基于矩阵的可扩展可视化来显示集合的交集、大小和其他属性。
UpSetR 可在 https://github.com/hms-dbmi/UpSetR/ 获得,并根据麻省理工学院的许可证发布。一个 Shiny 应用程序可在 https://gehlenborglab.shinyapps.io/upsetr/ 获得。
补充数据可在生物信息学在线获得。