Su Wei, Sun Jianqiang, Shimizu Kentaro, Kadota Koji
Graduate School of Agricultural and Life Sciences, The University of Tokyo, Yayoi 1-1-1, Bunkyo-ku, Tokyo, 113-8657, Japan.
Collaborative Research Institute for Innovative Microbiology, The University of Tokyo, Yayoi 1-1-1, Bunkyo-ku, Tokyo, 113-8657, Japan.
BMC Res Notes. 2019 Mar 13;12(1):133. doi: 10.1186/s13104-019-4179-2.
Differential expression (DE) is a fundamental step in the analysis of RNA-Seq count data. We had previously developed an R/Bioconductor package (called TCC) for this purpose. While this package has the unique feature of an in-built robust normalization method, its use has so far been limited to R users only. There is thus, a need for an alternative to DE analysis by TCC for non-R users.
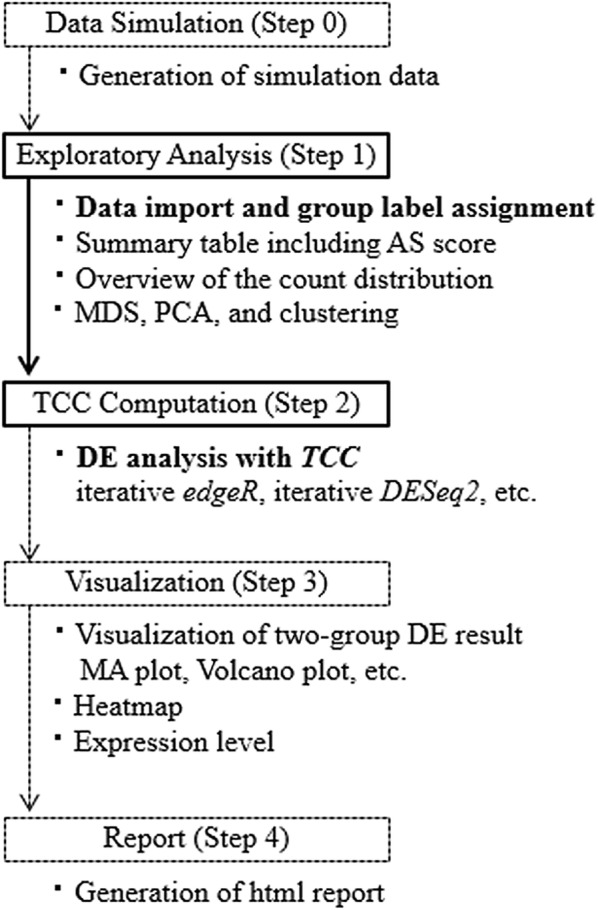
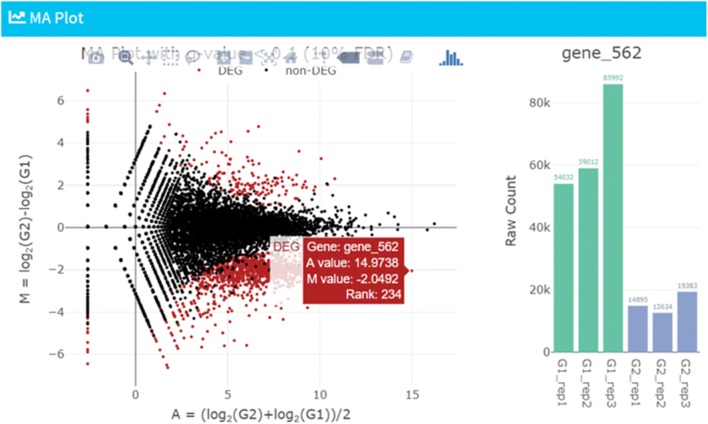
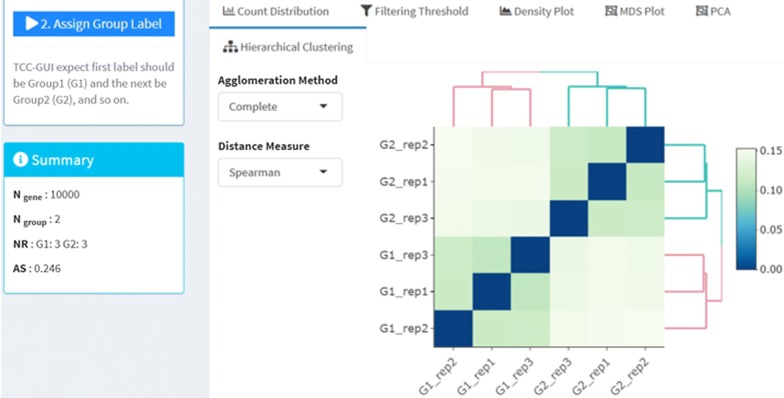
Here, we present a graphical user interface for TCC (called TCC-GUI). Non-R users only need a web browser as the minimum requirement for its use ( https://infinityloop.shinyapps.io/TCC-GUI/ ). TCC-GUI is implemented in R and encapsulated in Shiny application. It contains all the major functionalities of TCC, including DE pipelines with robust normalization and simulation data generation under various conditions. It also contains (i) tools for exploratory analysis, including a useful score termed average silhouette that measures the degree of separation of compared groups, (ii) visualization tools such as volcano plot and heatmap with hierarchical clustering, and (iii) a reporting tool using R Markdown. By virtue of the Shiny-based GUI framework, users can obtain results simply by mouse navigation. The source code for TCC-GUI is available at https://github.com/swsoyee/TCC-GUI under MIT license.
差异表达(DE)是RNA序列计数数据分析的基本步骤。我们之前为此开发了一个R/Bioconductor软件包(称为TCC)。虽然这个软件包具有内置稳健归一化方法的独特功能,但到目前为止它的使用仅限于R用户。因此,对于非R用户来说,需要一种替代TCC进行差异表达分析的方法。
在此,我们展示了一个用于TCC的图形用户界面(称为TCC-GUI)。非R用户使用它的最低要求只需一个网页浏览器(https://infinityloop.shinyapps.io/TCC-GUI/)。TCC-GUI用R实现并封装在Shiny应用程序中。它包含TCC的所有主要功能,包括具有稳健归一化的差异表达流程以及在各种条件下生成模拟数据。它还包含:(i)探索性分析工具,包括一个有用的分数,即衡量比较组分离程度的平均轮廓系数;(ii)可视化工具,如火山图和带有层次聚类的热图;以及(iii)一个使用R Markdown的报告工具。借助基于Shiny的图形用户界面框架,用户只需通过鼠标操作就能获得结果。TCC-GUI的源代码可在https://github.com/swsoyee/TCC-GUI上获取,遵循MIT许可协议。