• 文献检索
  • 文档翻译
  • 深度研究
  • 学术资讯
  • Suppr Zotero 插件Zotero 插件
  • 邀请有礼
  • 套餐&价格
  • 历史记录
应用&插件
Suppr Zotero 插件Zotero 插件浏览器插件Mac 客户端Windows 客户端微信小程序
定价
高级版会员购买积分包购买API积分包
服务
文献检索文档翻译深度研究API 文档MCP 服务
关于我们
关于 Suppr公司介绍联系我们用户协议隐私条款
关注我们

Suppr 超能文献

核心技术专利:CN118964589B侵权必究
粤ICP备2023148730 号-1Suppr @ 2026

文献检索

告别复杂PubMed语法,用中文像聊天一样搜索,搜遍4000万医学文献。AI智能推荐,让科研检索更轻松。

立即免费搜索

文件翻译

保留排版,准确专业,支持PDF/Word/PPT等文件格式,支持 12+语言互译。

免费翻译文档

深度研究

AI帮你快速写综述,25分钟生成高质量综述,智能提取关键信息,辅助科研写作。

立即免费体验

相似文献

1
Comparison of region-of-interest-averaged and pixel-averaged analysis of DCE-MRI data based on simulations and pre-clinical experiments.基于模拟和临床前实验的DCE-MRI数据的感兴趣区域平均分析与像素平均分析的比较
Phys Med Biol. 2017 Sep 5;62(18):N445-N459. doi: 10.1088/1361-6560/aa84d6.
2
Signal intensity form of the Tofts model for quantitative analysis of prostate dynamic contrast enhanced MRI data.Tofts 模型的信号强度形式用于前列腺动态对比增强 MRI 数据的定量分析。
Phys Med Biol. 2021 Jan 22;66(2):025002. doi: 10.1088/1361-6560/abca02.
3
Reproducibility of dynamic contrast-enhanced MRI in human muscle and tumours: comparison of quantitative and semi-quantitative analysis.动态对比增强磁共振成像在人体肌肉和肿瘤中的可重复性:定量与半定量分析的比较
NMR Biomed. 2002 Apr;15(2):132-42. doi: 10.1002/nbm.731.
4
Intra-individual comparison of different gadolinium-based contrast agents in the quantitative evaluation of C6 glioma with dynamic contrast-enhanced magnetic resonance imaging.动态对比增强磁共振成像定量评估 C6 胶质瘤中不同钆基对比剂的个体内比较。
Sci China Life Sci. 2017 Jan;60(1):11-15. doi: 10.1007/s11427-016-0386-2. Epub 2017 Jan 4.
5
Reproducibility of the aortic input function (AIF) derived from dynamic contrast-enhanced magnetic resonance imaging (DCE-MRI) of the kidneys in a volunteer study.志愿者研究中通过肾脏动态对比增强磁共振成像(DCE-MRI)得出的主动脉输入函数(AIF)的可重复性。
Eur J Radiol. 2009 Sep;71(3):576-81. doi: 10.1016/j.ejrad.2008.09.025. Epub 2008 Nov 11.
6
A simulation study comparing nine mathematical models of arterial input function for dynamic contrast enhanced MRI to the Parker model.一项模拟研究,将用于动态对比增强磁共振成像的九种动脉输入函数数学模型与帕克模型进行比较。
Australas Phys Eng Sci Med. 2018 Jun;41(2):507-518. doi: 10.1007/s13246-018-0632-0. Epub 2018 Mar 23.
7
A compact solution for estimation of physiological parameters from ultrafast prostate dynamic contrast enhanced MRI.从超快前列腺动态对比增强 MRI 中估计生理参数的紧凑解决方案。
Phys Med Biol. 2019 Aug 7;64(15):155012. doi: 10.1088/1361-6560/ab2b62.
8
Dynamic contrast enhanced-MRI in head and neck cancer patients: variability of the precontrast longitudinal relaxation time (T10).头部和颈部癌症患者的动态对比增强 MRI:预对比纵向弛豫时间(T10)的可变性。
Med Phys. 2010 Jun;37(6):2683-92. doi: 10.1118/1.3427487.
9
R2* Relaxation Affects Pharmacokinetic Analysis of Dynamic Contrast-Enhanced MRI in Cancer and Underestimates Treatment Response at 7 T.R2* 弛豫影响癌症动态对比增强磁共振成像的药代动力学分析,并低估了 7T 时的治疗反应。
Tomography. 2019 Sep;5(3):308-319. doi: 10.18383/j.tom.2019.00015.
10
Correlations of 3T DCE-MRI quantitative parameters with microvessel density in a human-colorectal-cancer xenograft mouse model.3T DCE-MRI 定量参数与人结直肠癌异种移植瘤模型中小血管密度的相关性。
Korean J Radiol. 2011 Nov-Dec;12(6):722-30. doi: 10.3348/kjr.2011.12.6.722. Epub 2011 Sep 27.

引用本文的文献

1
Test-Retest Performance of a 1-Hour Multiparametric MR Image Acquisition Pipeline With Orthotopic Triple-Negative Breast Cancer Patient-Derived Tumor Xenografts.使用原位三阴性乳腺癌患者来源的肿瘤异种移植进行1小时多参数MR图像采集流程的重测性能。
Tomography. 2019 Sep;5(3):320-331. doi: 10.18383/j.tom.2019.00012.
2
A compact solution for estimation of physiological parameters from ultrafast prostate dynamic contrast enhanced MRI.从超快前列腺动态对比增强 MRI 中估计生理参数的紧凑解决方案。
Phys Med Biol. 2019 Aug 7;64(15):155012. doi: 10.1088/1361-6560/ab2b62.

本文引用的文献

1
DCE-MRI of the prostate using shutter-speed vs. Tofts model for tumor characterization and assessment of aggressiveness.使用快门速度与 Tofts 模型对前列腺进行 DCE-MRI,用于肿瘤特征描述和侵袭性评估。
J Magn Reson Imaging. 2017 Sep;46(3):837-849. doi: 10.1002/jmri.25631. Epub 2017 Jan 16.
2
Fractal Dimension of Tumor Microvasculature by DCE-US: Preliminary Study in Mice.动态对比增强超声评估肿瘤微血管的分形维数:小鼠初步研究
Ultrasound Med Biol. 2016 Dec;42(12):2852-2863. doi: 10.1016/j.ultrasmedbio.2016.08.001. Epub 2016 Sep 2.
3
Relative sensitivities of DCE-MRI pharmacokinetic parameters to arterial input function (AIF) scaling.动态对比增强磁共振成像(DCE-MRI)药代动力学参数对动脉输入函数(AIF)缩放的相对敏感性。
J Magn Reson. 2016 Aug;269:104-112. doi: 10.1016/j.jmr.2016.05.018. Epub 2016 May 28.
4
Optimized Fast Dynamic Contrast-Enhanced Magnetic Resonance Imaging of the Prostate: Effect of Sampling Duration on Pharmacokinetic Parameters.前列腺优化快速动态对比增强磁共振成像:采样持续时间对药代动力学参数的影响
Invest Radiol. 2016 Feb;51(2):106-12. doi: 10.1097/RLI.0000000000000213.
5
Pharmacokinetic analysis of prostate cancer using independent component analysis.使用独立成分分析对前列腺癌进行药代动力学分析。
Magn Reson Imaging. 2015 Dec;33(10):1236-1245. doi: 10.1016/j.mri.2015.08.009. Epub 2015 Aug 20.
6
Dependence of DCE-MRI biomarker values on analysis algorithm.动态对比增强磁共振成像(DCE-MRI)生物标志物值对分析算法的依赖性。
PLoS One. 2015 Jul 24;10(7):e0130168. doi: 10.1371/journal.pone.0130168. eCollection 2015.
7
Prostate Cancer: assessing the effects of androgen-deprivation therapy using quantitative diffusion-weighted and dynamic contrast-enhanced MRI.前列腺癌:使用定量扩散加权和动态对比增强磁共振成像评估雄激素剥夺疗法的效果
Eur Radiol. 2015 Sep;25(9):2665-72. doi: 10.1007/s00330-015-3688-1. Epub 2015 Mar 29.
8
Practical dynamic contrast enhanced MRI in small animal models of cancer: data acquisition, data analysis, and interpretation.实用的小动物癌症模型动态对比增强 MRI:数据采集、数据分析和解读。
Pharmaceutics. 2012;4(3):442-78. doi: 10.3390/pharmaceutics4030442.
9
Monitoring anti-angiogenic therapy in colorectal cancer murine model using dynamic contrast-enhanced MRI: comparing pixel-by-pixel with region of interest analysis.使用动态对比增强 MRI 监测结直肠癌小鼠模型中的抗血管生成治疗:像素分析与感兴趣区分析的比较。
Technol Cancer Res Treat. 2013 Feb;12(1):71-8. doi: 10.7785/tcrt.2012.500255. Epub 2012 Aug 10.
10
Washout gradient in dynamic contrast-enhanced MRI is associated with tumor aggressiveness of prostate cancer.动态对比增强 MRI 的洗脱梯度与前列腺癌的肿瘤侵袭性相关。
J Magn Reson Imaging. 2012 Oct;36(4):912-9. doi: 10.1002/jmri.23723. Epub 2012 Jun 18.

基于模拟和临床前实验的DCE-MRI数据的感兴趣区域平均分析与像素平均分析的比较

Comparison of region-of-interest-averaged and pixel-averaged analysis of DCE-MRI data based on simulations and pre-clinical experiments.

作者信息

He Dianning, Zamora Marta, Oto Aytekin, Karczmar Gregory S, Fan Xiaobing

机构信息

Sino-Dutch Biomedical and Information Engineering School, Northeastern University, Shenyang, People's Republic of China. Department of Radiology, The University of Chicago, Chicago, IL 60637, United States of America.

出版信息

Phys Med Biol. 2017 Sep 5;62(18):N445-N459. doi: 10.1088/1361-6560/aa84d6.

DOI:10.1088/1361-6560/aa84d6
PMID:28786402
原文链接:https://pmc.ncbi.nlm.nih.gov/articles/PMC5736132/
Abstract

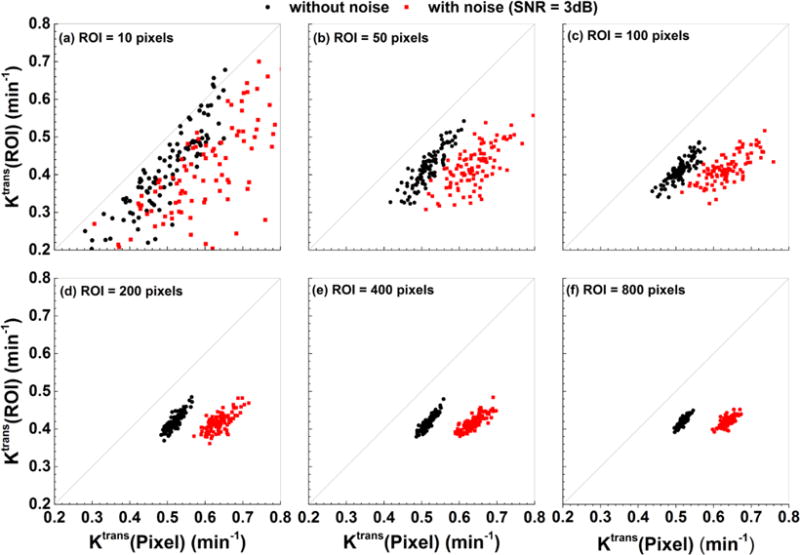
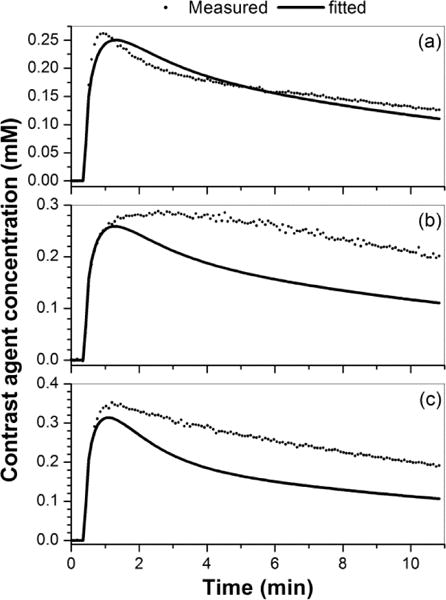
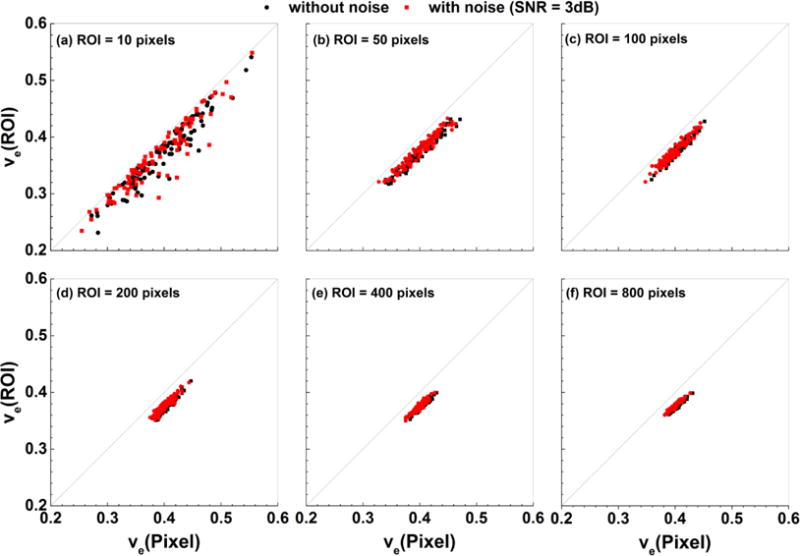
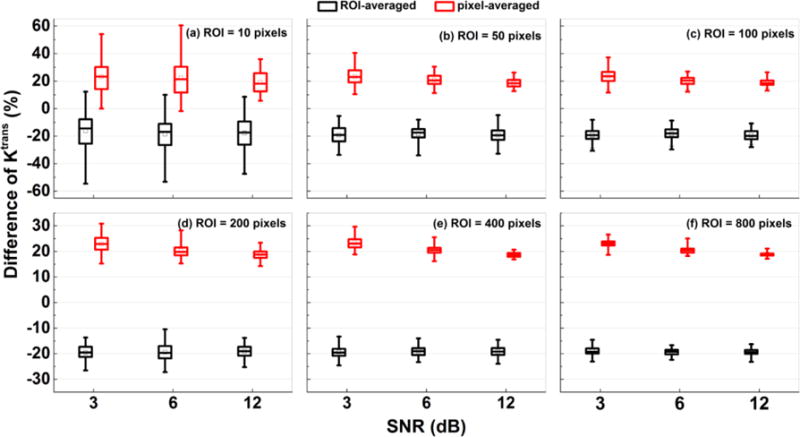
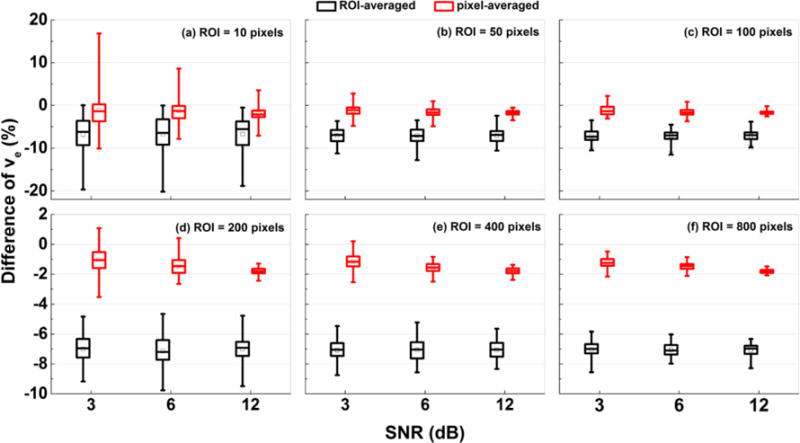
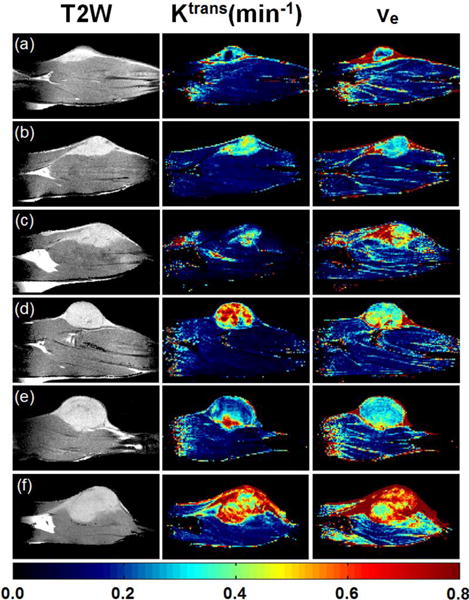
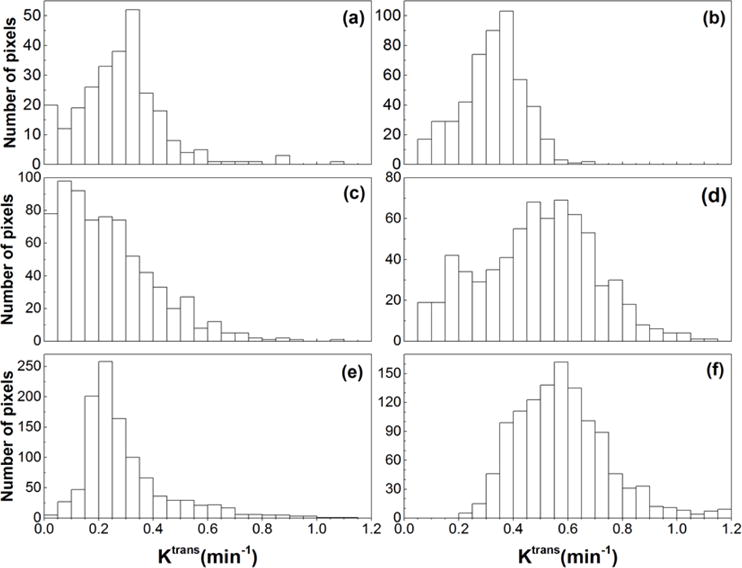
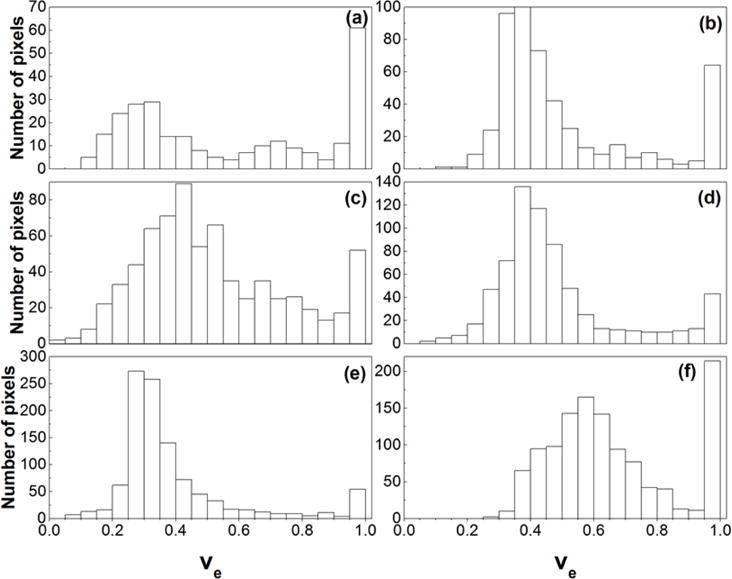
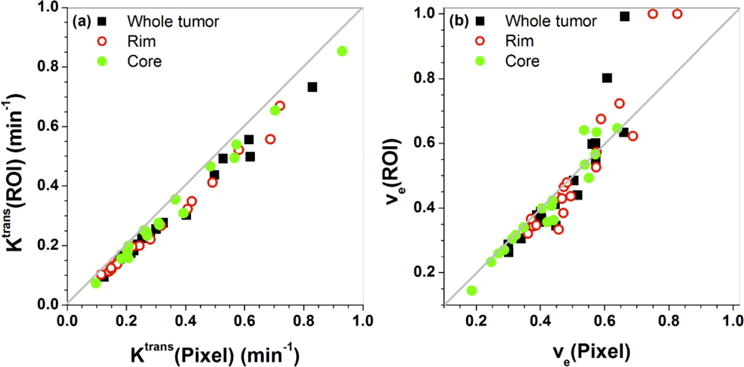
Differences between region-of-interest (ROI) and pixel-by-pixel analysis of dynamic contrast enhanced (DCE) MRI data were investigated in this study with computer simulations and pre-clinical experiments. ROIs were simulated with 10, 50, 100, 200, 400, and 800 different pixels. For each pixel, a contrast agent concentration as a function of time, C(t), was calculated using the Tofts DCE-MRI model with randomly generated physiological parameters (K and v ) and the Parker population arterial input function. The average C(t) for each ROI was calculated and then K and v for the ROI was extracted. The simulations were run 100 times for each ROI with new K and v generated. In addition, white Gaussian noise was added to C(t) with 3, 6, and 12 dB signal-to-noise ratios to each C(t). For pre-clinical experiments, Copenhagen rats (n  =  6) with implanted prostate tumors in the hind limb were used in this study. The DCE-MRI data were acquired with a temporal resolution of ~5 s in a 4.7 T animal scanner, before, during, and after a bolus injection (<5 s) of Gd-DTPA for a total imaging duration of ~10 min. K and v were calculated in two ways: (i) by fitting C(t) for each pixel, and then averaging the pixel values over the entire ROI, and (ii) by averaging C(t) over the entire ROI, and then fitting averaged C(t) to extract K and v . The simulation results showed that in heterogeneous ROIs, the pixel-by-pixel averaged K was ~25% to ~50% larger (p  <  0.01) than the ROI-averaged K . At higher noise levels, the pixel-averaged K was greater than the 'true' K , but the ROI-averaged K was lower than the 'true' K . The ROI-averaged K was closer to the true K than pixel-averaged K for high noise levels. In pre-clinical experiments, the pixel-by-pixel averaged K was ~15% larger than the ROI-averaged K . Overall, with the Tofts model, the extracted physiological parameters from the pixel-by-pixel averages were larger than the ROI averages. These differences were dependent on the heterogeneity of the ROI.

摘要

本研究通过计算机模拟和临床前实验,对动态对比增强(DCE)MRI数据的感兴趣区域(ROI)分析和逐像素分析之间的差异进行了研究。使用10、50、100、200、400和800个不同像素模拟ROI。对于每个像素,使用具有随机生成的生理参数(K和v)的Tofts DCE-MRI模型以及Parker群体动脉输入函数,计算作为时间函数的造影剂浓度C(t)。计算每个ROI的平均C(t),然后提取该ROI的K和v。对于每个ROI,使用新生成的K和v运行模拟100次。此外,以3、6和12分贝的信噪比向每个C(t)添加白色高斯噪声。对于临床前实验,本研究使用了后肢植入前列腺肿瘤的哥本哈根大鼠(n = 6)。在4.7 T动物扫描仪中,在静脉注射钆喷酸葡胺(<5 s)之前、期间和之后,以约5 s的时间分辨率采集DCE-MRI数据,总成像持续时间约为10分钟。K和v通过两种方式计算:(i)对每个像素的C(t)进行拟合,然后在整个ROI上对像素值求平均值;(ii)在整个ROI上对C(t)求平均值,然后对平均后的C(t)进行拟合以提取K和v。模拟结果表明,在异质ROI中,逐像素平均的K比ROI平均的K大25%至50%(p < 0.01)。在较高噪声水平下,像素平均的K大于“真实”K,但ROI平均的K低于“真实”K。对于高噪声水平,ROI平均的K比像素平均的K更接近真实K。在临床前实验中,逐像素平均的K比ROI平均的K大~15%。总体而言,使用Tofts模型,从逐像素平均值中提取的生理参数大于ROI平均值。这些差异取决于ROI的异质性。

https://cdn.ncbi.nlm.nih.gov/pmc/blobs/0544/5736132/4ccce551b44d/nihms924918f9.jpg
https://cdn.ncbi.nlm.nih.gov/pmc/blobs/0544/5736132/75e3e068419d/nihms924918f1.jpg
https://cdn.ncbi.nlm.nih.gov/pmc/blobs/0544/5736132/bf51ad6b829b/nihms924918f2.jpg
https://cdn.ncbi.nlm.nih.gov/pmc/blobs/0544/5736132/f10975b3cb89/nihms924918f3.jpg
https://cdn.ncbi.nlm.nih.gov/pmc/blobs/0544/5736132/7b99f7dca22c/nihms924918f4.jpg
https://cdn.ncbi.nlm.nih.gov/pmc/blobs/0544/5736132/683ad479b829/nihms924918f5.jpg
https://cdn.ncbi.nlm.nih.gov/pmc/blobs/0544/5736132/10f49500b7e8/nihms924918f6.jpg
https://cdn.ncbi.nlm.nih.gov/pmc/blobs/0544/5736132/ac3bfada5b82/nihms924918f7.jpg
https://cdn.ncbi.nlm.nih.gov/pmc/blobs/0544/5736132/704605dac54c/nihms924918f8.jpg
https://cdn.ncbi.nlm.nih.gov/pmc/blobs/0544/5736132/4ccce551b44d/nihms924918f9.jpg