Gasparini Luciana S, Macedo Nayana D, Pimentel Elisângela F, Fronza Marcio, Junior Valdemar L, Borges Warley S, Cole Eduardo R, Andrade Tadeu U, Endringer Denise C, Lenz Dominik
University Vila Velha, Pharmaceutical Sciences, Vitória, Brazil.
Federal University of Espírito Santo, Vitória, Brazil.
Pharmacogn Mag. 2017 Jul;13(Suppl 2):S365-S369. doi: 10.4103/0973-1296.210176. Epub 2017 Jul 11.
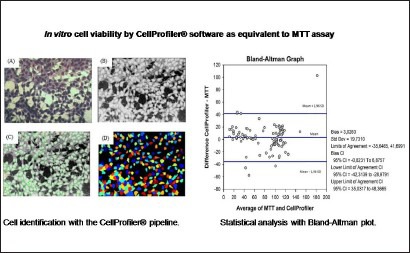
This study evaluated cell viability by the colorimetric MTT stands for 3-(4,5-dimethylthiazol-2-yl)-2,5-diphenyltetrazolium bromide (3-(4, 5-dimethylthiazolyl-2)-2, 5-diphenyltetrazolium bromide) (3-(4, 5-dimethylthiazolyl-2)-2, 5-diphenyltetrazolium bromide) assay compared to image analysis by CellProfiler software.
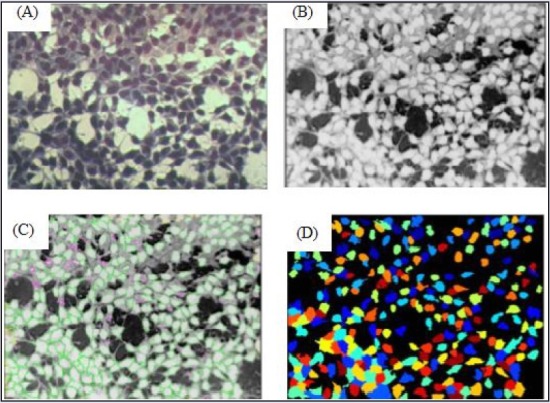
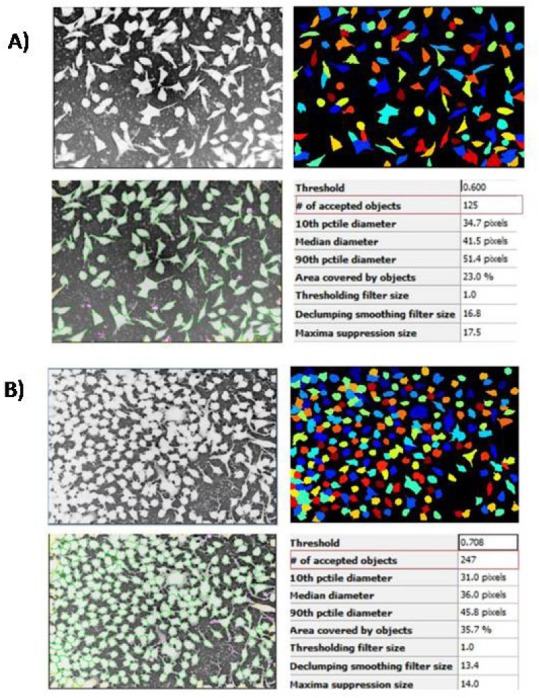
Hepatoma (Hepa-1c1c7) and fibroblast (L929) cells were exposed to isolated substances, camptothecin, lycorine, tazettine, albomaculine, 3-epimacronine, trispheridine, galanthine and , sp. methanolic extract, and Ravenna ethyl acetate in different concentrations. After MTT assay, cells were stained with Panotic dye kit. Cell images were obtained with an inverted microscope equipped with a digital camera. The images were analyzed by CellProfiler.
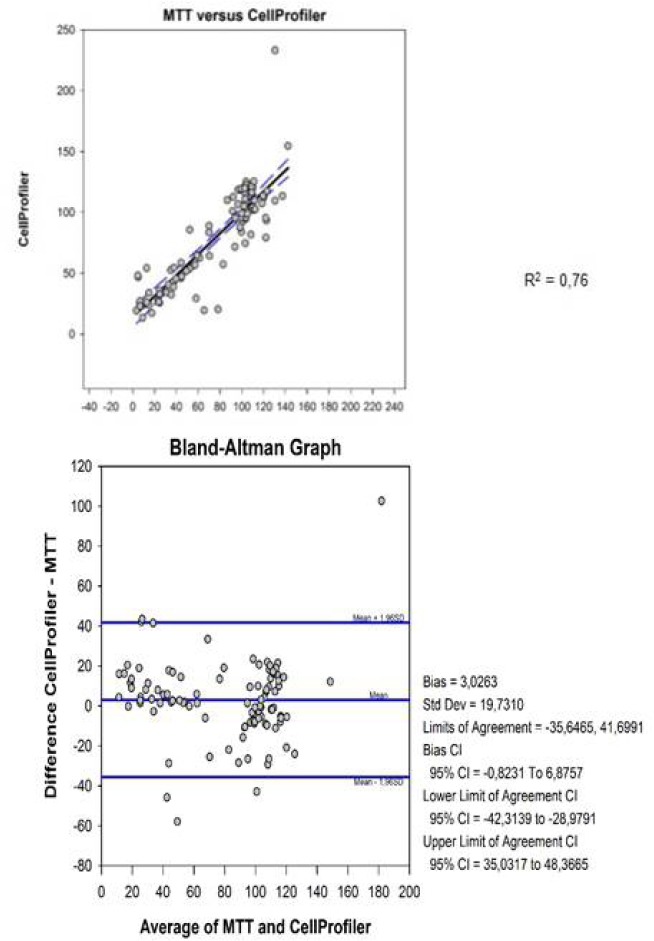
No cytotoxicity at the highest concentration analyzed for 3-epimacronine, albomaculine, galanthine, trispheridine, extract and sp. extract where detected. Tazettine offered cytotoxicity only against the Hepa1c1c7 cell line. Lycorine, camptothecin, and extract exhibited cytotoxic effects in both cell lines. The viability methods tested were correlated demonstrated by Bland-Atman test with normal distribution with mean difference between the two methods close to zero, bias value 3.0263. The error was within the limits of the confidence intervals and these values had a narrow difference. The correlation between the two methods was demonstrated by the linear regression plotted as R.
CellProfiler image analysis presented similar results to the MTT assay in the identification of viable cells, and image analysis may assist part of biological analysis procedures. The presented methodology is inexpensive and reproducible.
cell viability assessment with MTT (3-(4, 5-dimethylthiazolyl-2)-2, 5-diphenyltetrazolium bromide) assay may be replaced by image analysis by CellProfiler. The viability methods tested were correlated demonstrated by Bland-Atman test with normal distribution with mean difference between the two methods close to zero, bias value 3.0263. The correlation between the two methods was demonstrated by the linear regression plotted as R2. HPLC: High pressure liquid chromatography MTT: (3-(4, 5-dimethylthiazolyl-2)-2, 5-diphenyltetrazolium bromide) (3-(4, 5-dimethylthiazolyl-2)-2, 5-diphenyltetrazolium bromide).
本研究通过比色法MTT(3-(4,5-二甲基噻唑-2-基)-2,5-二苯基四氮唑溴盐)检测评估细胞活力,并与使用CellProfiler软件进行图像分析的结果进行比较。
将肝癌(Hepa-1c1c7)和成纤维细胞(L929)暴露于不同浓度的喜树碱、石蒜碱、水仙碱、白绵马素、3-表宏马宁、三球定、加兰他敏以及 提取物和 提取物中。MTT检测后,用Panotic染料试剂盒对细胞进行染色。使用配备数码相机的倒置显微镜获取细胞图像。通过CellProfiler对图像进行分析。
在分析的最高浓度下,未检测到3-表宏马宁、白绵马素、加兰他敏、三球定、 提取物和 提取物具有细胞毒性。水仙碱仅对Hepa1c1c7细胞系具有细胞毒性。石蒜碱、喜树碱和 提取物在两种细胞系中均表现出细胞毒性作用。通过Bland-Atman检验证明所测试的活力检测方法呈正态分布,两种方法之间的平均差异接近零,偏差值为3.0263。误差在置信区间范围内,且这些值的差异较小。通过绘制为R的线性回归证明了两种方法之间的相关性。
在活细胞鉴定方面,CellProfiler图像分析呈现出与MTT检测相似的结果,图像分析可辅助部分生物学分析程序。所提出的方法成本低廉且可重复。
使用MTT(3-(4,5-二甲基噻唑-2-基)-2,5-二苯基四氮唑溴盐)检测评估细胞活力可被CellProfiler图像分析所取代。通过Bland-Atman检验证明所测试的活力检测方法呈正态分布,两种方法之间的平均差异接近零,偏差值为3.0263。通过绘制为R²的线性回归证明了两种方法之间的相关性。HPLC:高压液相色谱法;MTT:(3-(4,5-二甲基噻唑-2-基)-2,5-二苯基四氮唑溴盐)(3-(4,5-二甲基噻唑基-2)-2,5-二苯基四氮唑溴盐)