Hermans Ben J M, Vink Arja S, Bennis Frank C, Filippini Luc H, Meijborg Veronique M F, Wilde Arthur A M, Pison Laurent, Postema Pieter G, Delhaas Tammo
Department of Biomedical Engineering, Maastricht University, Maastricht, The Netherlands.
Cardiovascular Research Institute Maastricht (CARIM), Maastricht University, Maastricht, The Netherlands.
PLoS One. 2017 Sep 1;12(9):e0184352. doi: 10.1371/journal.pone.0184352. eCollection 2017.
To evaluate QT-interval dynamics in patients and in drug safety analysis, beat-to-beat QT-interval measurements are increasingly used. However, interobserver differences, aberrant T-wave morphologies and changes in heart axis might hamper accurate QT-interval measurements.
To develop and validate a QT-interval algorithm robust to heart axis orientation and T-wave morphology that can be applied on a beat-to-beat basis.
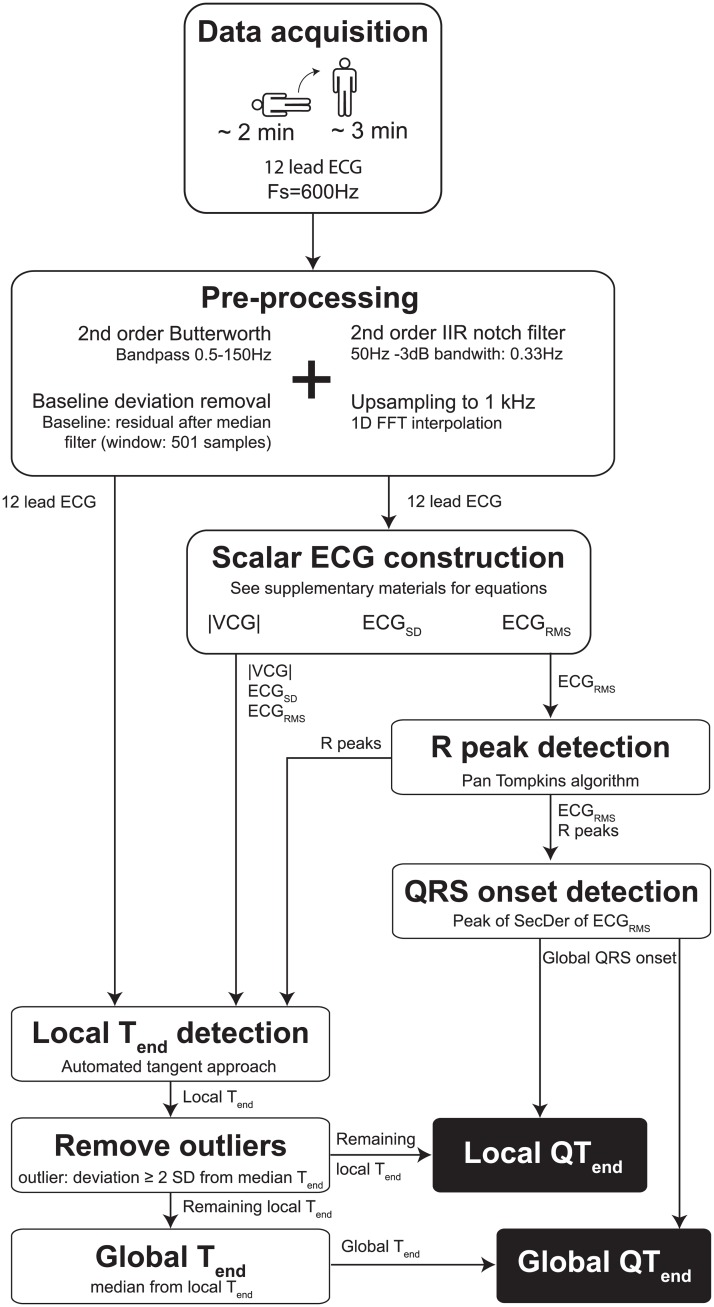
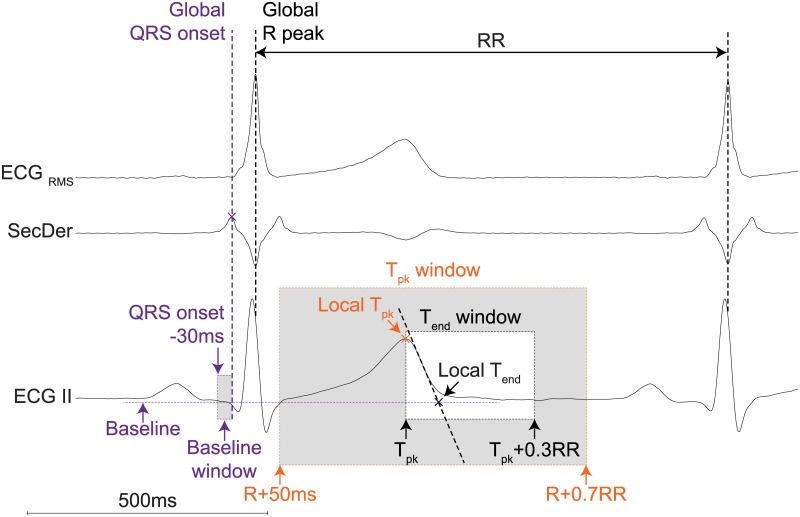
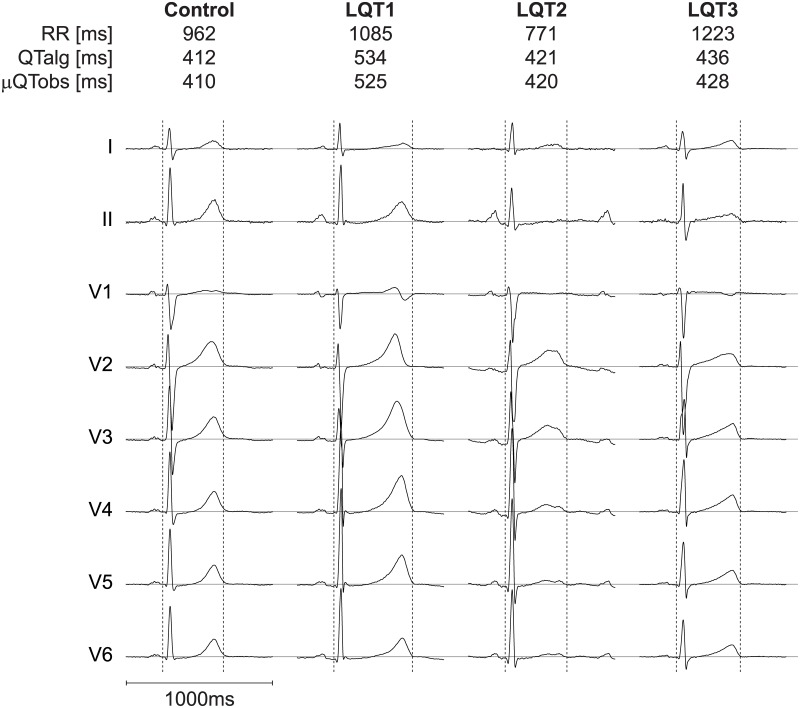
Additionally to standard ECG leads, the root mean square (ECGRMS), standard deviation and vectorcardiogram were used. QRS-onset was defined from the ECGRMS. T-wave end was defined per individual lead and scalar ECG using an automated tangent method. A median of all T-wave ends was used as the general T-wave end per beat. Supine-standing tests of 73 patients with Long-QT syndrome (LQTS) and 54 controls were used because they have wide ranges of RR and QT-intervals as well as changes in T-wave morphology and heart axis orientation. For each subject, automatically estimated QT-intervals in three random complexes chosen from the low, middle and high RR range, were compared with manually measured QT-intervals by three observers.
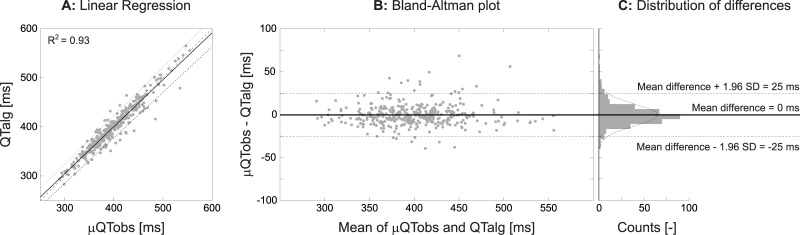
After visual inspection of the randomly selected complexes, 21 complexes were excluded because of evident noise, too flat T-waves or premature ventricular beats. Bland-Altman analyses of automatically and manually determined QT-intervals showed a bias of <4ms and limits of agreement of ±25ms. Intra-class coefficient indicated excellent agreement (>0.9) between the algorithm and all observers individually as well as between the algorithm and the mean QT-interval of the observers.
Our automated algorithm provides reliable beat-to-beat QT-interval assessment, robust to heart axis and T-wave morphology.
在患者评估和药物安全性分析中,逐搏测量QT间期越来越多地被用于评估QT间期动态变化。然而,观察者间差异、异常T波形态以及心电轴变化可能会妨碍QT间期的准确测量。
开发并验证一种对心电轴方向和T波形态具有鲁棒性的QT间期算法,该算法可逐搏应用。
除了标准心电图导联外,还使用了均方根(ECGRMS)、标准差和向量心电图。QRS波起始点由ECGRMS定义。使用自动切线法在每个单独导联和标量心电图上定义T波终点。所有T波终点的中位数用作每搏的总体T波终点。对73例长QT综合征(LQTS)患者和54例对照者进行仰卧-站立试验,因为他们的RR间期和QT间期范围广泛,同时T波形态和心电轴方向也会发生变化。对于每个受试者,从低、中、高RR间期范围中随机选择三个复合波自动估计的QT间期,与三位观察者手动测量的QT间期进行比较。
在对随机选择的复合波进行目视检查后,排除了21个复合波,原因是存在明显噪声、T波过于平坦或室性早搏。自动和手动测定的QT间期的Bland-Altman分析显示偏差<4ms,一致性界限为±25ms。组内系数表明该算法与所有观察者个体之间以及该算法与观察者的平均QT间期之间具有极好的一致性(>0.9)。
我们的自动算法提供了可靠的逐搏QT间期评估,对心电轴和T波形态具有鲁棒性。