Brand Eelco C, Crook Julia E, Thomas Colleen S, Siersema Peter D, Rex Douglas K, Wallace Michael B
Department of Gastroenterology and Hepatology, Mayo Clinic, Jacksonville, Florida, United States of America.
Department of Gastroenterology and Hepatology, University Medical Center Utrecht, Utrecht, the Netherlands.
PLoS One. 2017 Sep 28;12(9):e0185560. doi: 10.1371/journal.pone.0185560. eCollection 2017.
The adenoma detection rate (ADR) varies widely between physicians, possibly due to patient population differences, hampering direct ADR comparison. We developed and validated a prediction model for adenoma detection in an effort to determine if physicians' ADRs should be adjusted for patient-related factors.
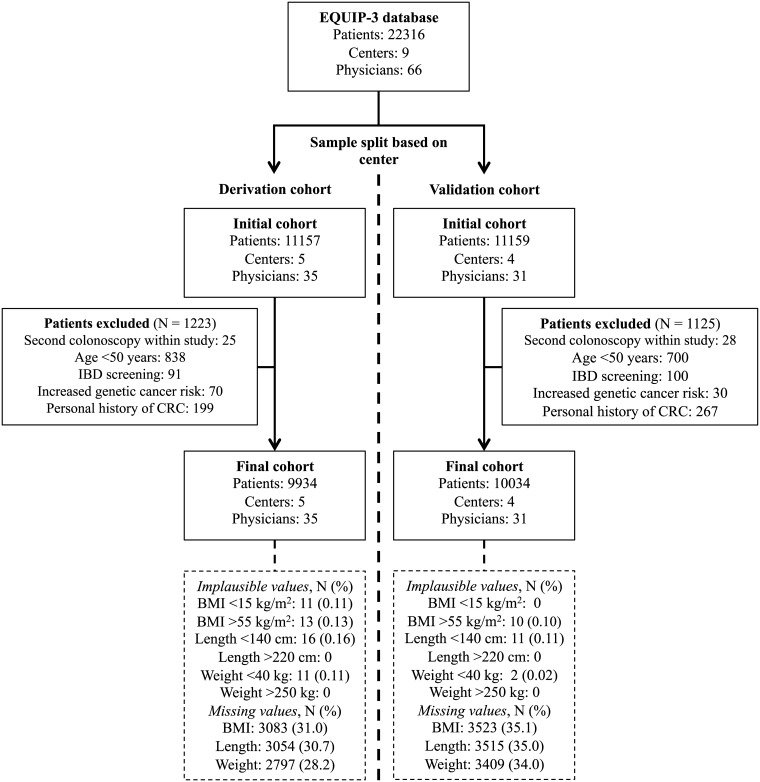
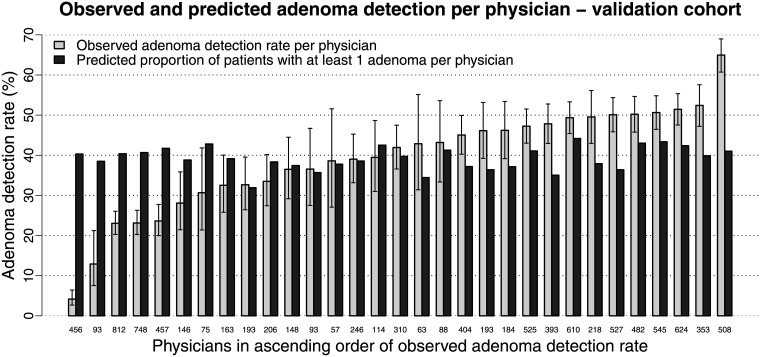
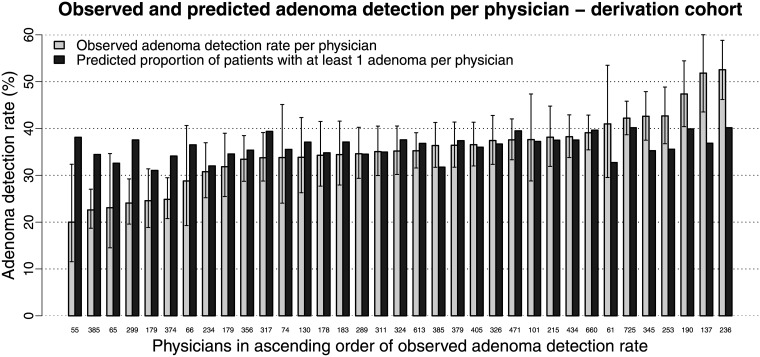
Screening and surveillance colonoscopy data from the cross-sectional multicenter cluster-randomized Endoscopic Quality Improvement Program-3 (EQUIP-3) study (NCT02325635) was used. The dataset was split into two cohorts based on center. A prediction model for detection of ≥1 adenoma was developed using multivariable logistic regression and subsequently internally (bootstrap resampling) and geographically validated. We compared predicted to observed ADRs.
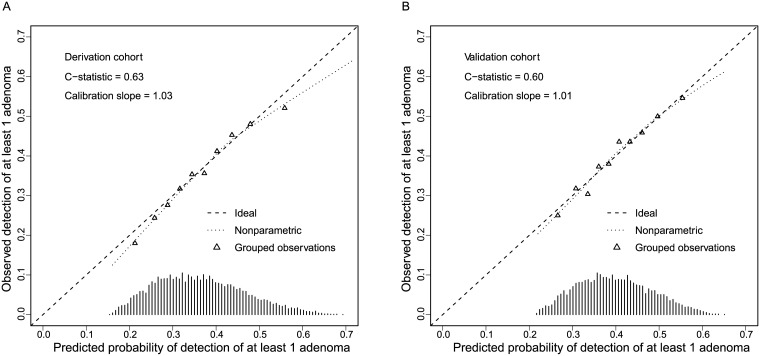
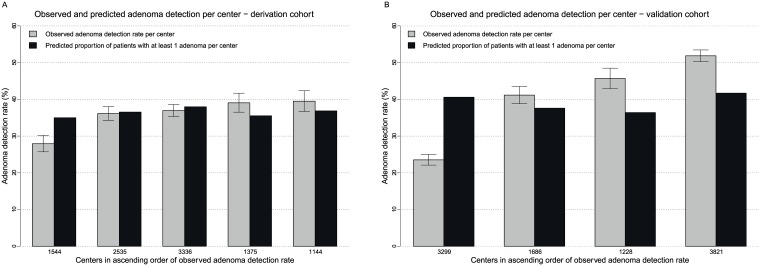
The derivation (5 centers, 35 physicians, overall-ADR: 36%) and validation (4 centers, 31 physicians, overall-ADR: 40%) cohort included respectively 9934 and 10034 patients (both cohorts: 48% male, median age 60 years). Independent predictors for detection of ≥1 adenoma were: age (optimism-corrected odds ratio (OR): 1.02; 95%-confidence interval (CI): 1.02-1.03), male sex (OR: 1.73; 95%-CI: 1.60-1.88), body mass index (OR: 1.02; 95%-CI: 1.01-1.03), American Society of Anesthesiology physical status class (OR class II vs. I: 1.29; 95%-CI: 1.17-1.43, OR class ≥III vs. I: 1.57; 95%-CI: 1.32-1.86), surveillance versus screening (OR: 1.39; 95%-CI: 1.27-1.53), and Hispanic or Latino ethnicity (OR: 1.13; 95%-CI: 1.00-1.27). The model's discriminative ability was modest (C-statistic in the derivation: 0.63 and validation cohort: 0.60). The observed ADR was considerably lower than predicted for 12/66 (18.2%) physicians and 2/9 (22.2%) centers, and considerably higher than predicted for 18/66 (27.3%) physicians and 4/9 (44.4%) centers.
The substantial variation in ADRs could only partially be explained by patient-related factors. These data suggest that ADR variation could likely also be due to other factors, e.g. physician or technical issues.
腺瘤检出率(ADR)在医生之间差异很大,可能是由于患者群体不同,这妨碍了ADR的直接比较。我们开发并验证了一种腺瘤检测预测模型,以确定是否应针对患者相关因素对医生的ADR进行调整。
使用了横断面多中心整群随机内镜质量改进计划-3(EQUIP-3)研究(NCT02325635)中的筛查和监测结肠镜检查数据。根据中心将数据集分为两个队列。使用多变量逻辑回归建立了检测≥1个腺瘤的预测模型,随后进行了内部(自助重采样)和地理验证。我们比较了预测的ADR和观察到的ADR。
推导队列(5个中心,35名医生,总体ADR:36%)和验证队列(4个中心,31名医生,总体ADR:40%)分别包括9934例和10034例患者(两个队列:48%为男性,中位年龄60岁)。检测≥1个腺瘤的独立预测因素为:年龄(乐观校正比值比(OR):1.02;95%置信区间(CI):1.02-1.03)、男性(OR:1.73;95%CI:1.60-1.88)、体重指数(OR:1.02;95%CI:1.01-1.03)、美国麻醉医师协会身体状况分级(II级与I级相比的OR:1.29;95%CI:1.17-1.43,≥III级与I级相比的OR:1.57;95%CI:1.32-1.86)、监测与筛查(OR:1.39;95%CI:1.27-1.53)以及西班牙裔或拉丁裔种族(OR:1.13;95%CI:1.00-1.27)。该模型的判别能力中等(推导队列中的C统计量为0.63,验证队列为0.60)。观察到的ADR显著低于12/66(18.2%)的医生和2/9(22.2%)的中心预测值,且显著高于18/66(27.3%)的医生和4/9(44.4%)的中心预测值。
ADR的显著差异只能部分由患者相关因素解释。这些数据表明,ADR差异可能也归因于其他因素,如医生或技术问题。