• 文献检索
  • 文档翻译
  • 深度研究
  • 学术资讯
  • Suppr Zotero 插件Zotero 插件
  • 邀请有礼
  • 套餐&价格
  • 历史记录
应用&插件
Suppr Zotero 插件Zotero 插件浏览器插件Mac 客户端Windows 客户端微信小程序
定价
高级版会员购买积分包购买API积分包
服务
文献检索文档翻译深度研究API 文档MCP 服务
关于我们
关于 Suppr公司介绍联系我们用户协议隐私条款
关注我们

Suppr 超能文献

核心技术专利:CN118964589B侵权必究
粤ICP备2023148730 号-1Suppr @ 2026

文献检索

告别复杂PubMed语法,用中文像聊天一样搜索,搜遍4000万医学文献。AI智能推荐,让科研检索更轻松。

立即免费搜索

文件翻译

保留排版,准确专业,支持PDF/Word/PPT等文件格式,支持 12+语言互译。

免费翻译文档

深度研究

AI帮你快速写综述,25分钟生成高质量综述,智能提取关键信息,辅助科研写作。

立即免费体验

Clustergrammer,一个基于网络的高维生物数据热图可视化和分析工具。

Clustergrammer, a web-based heatmap visualization and analysis tool for high-dimensional biological data.

机构信息

Department of Pharmacological Sciences, Mount Sinai Center for Bioinformatics, BD2K-LINCS Data Coordination and Integration Center (DCIC), Icahn School of Medicine at Mount Sinai, New York, New York 10029, USA.

Human Immune Monitoring Core, Icahn School of Medicine at Mount Sinai, New York, New York 10029, USA.

出版信息

Sci Data. 2017 Oct 10;4:170151. doi: 10.1038/sdata.2017.151.

DOI:10.1038/sdata.2017.151
PMID:28994825
原文链接:https://pmc.ncbi.nlm.nih.gov/articles/PMC5634325/
Abstract

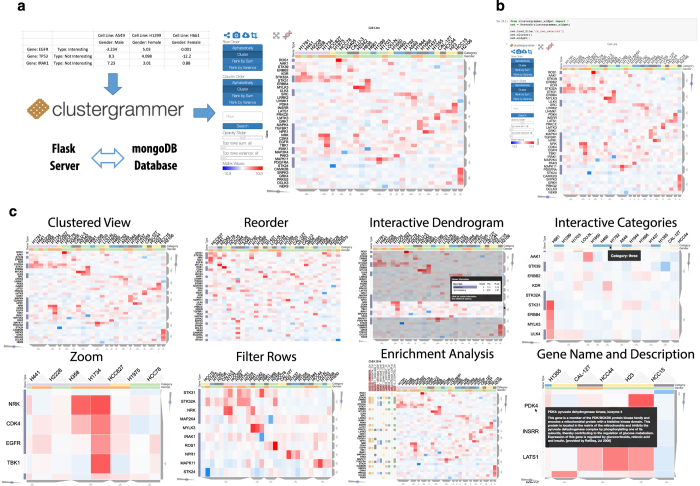
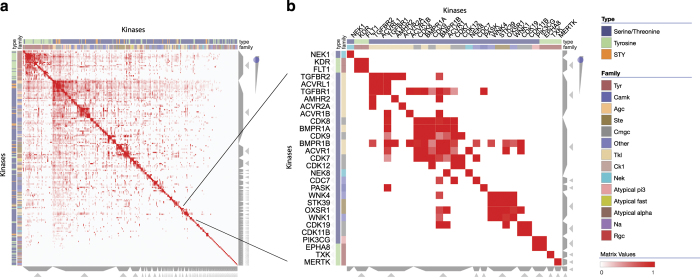
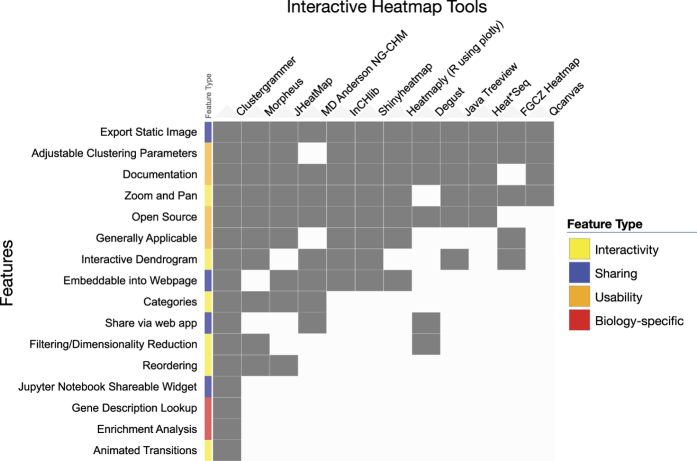
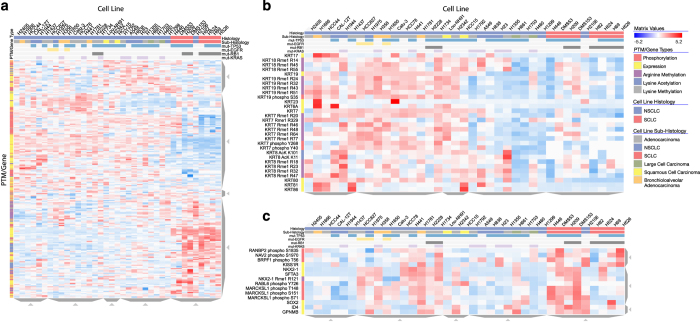
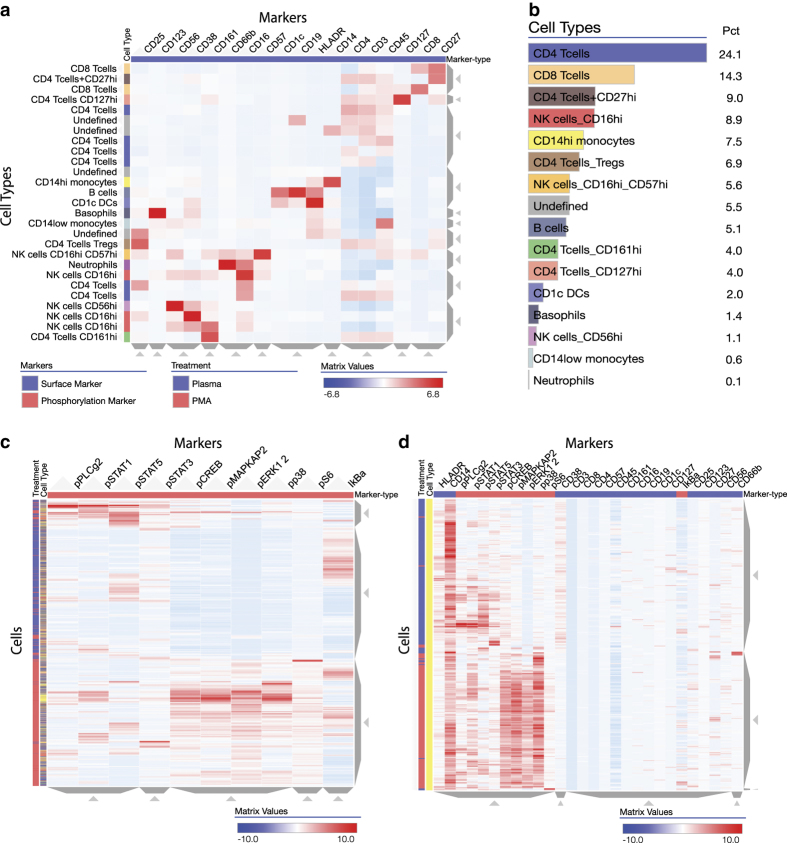
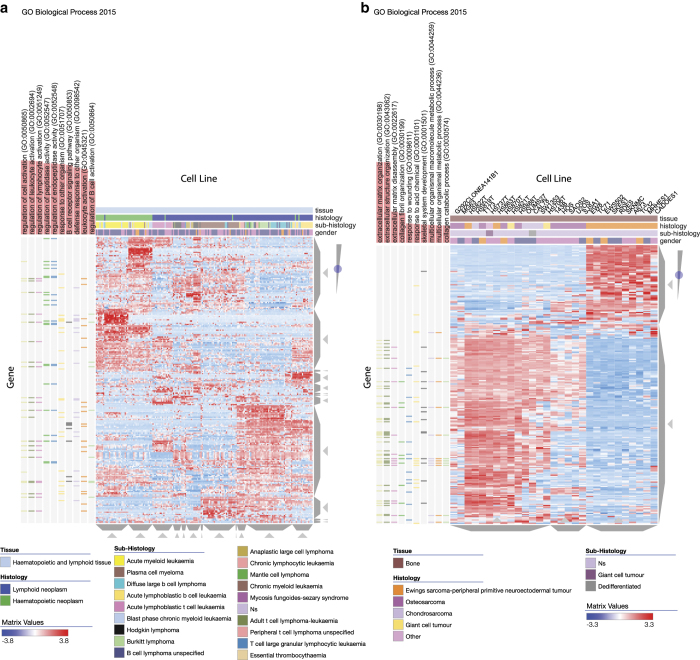
Most tools developed to visualize hierarchically clustered heatmaps generate static images. Clustergrammer is a web-based visualization tool with interactive features such as: zooming, panning, filtering, reordering, sharing, performing enrichment analysis, and providing dynamic gene annotations. Clustergrammer can be used to generate shareable interactive visualizations by uploading a data table to a web-site, or by embedding Clustergrammer in Jupyter Notebooks. The Clustergrammer core libraries can also be used as a toolkit by developers to generate visualizations within their own applications. Clustergrammer is demonstrated using gene expression data from the cancer cell line encyclopedia (CCLE), original post-translational modification data collected from lung cancer cells lines by a mass spectrometry approach, and original cytometry by time of flight (CyTOF) single-cell proteomics data from blood. Clustergrammer enables producing interactive web based visualizations for the analysis of diverse biological data.

摘要

大多数用于可视化层次聚类热图的工具生成静态图像。Clustergrammer 是一个基于网络的可视化工具,具有交互功能,如:缩放、平移、过滤、重新排序、共享、进行富集分析以及提供动态基因注释。Clustergrammer 可以通过将数据表上传到网站,或者通过在 Jupyter Notebooks 中嵌入 Clustergrammer,来生成可共享的交互式可视化效果。Clustergrammer 的核心库也可以被开发人员用作工具包,以便在他们自己的应用程序中生成可视化效果。本文使用癌症细胞系百科全书(CCLE)的基因表达数据、通过质谱方法从肺癌细胞系中收集的原始翻译后修饰数据以及来自血液的原始飞行时间(CyTOF)单细胞蛋白质组学数据,对 Clustergrammer 进行了演示。Clustergrammer 能够为各种生物数据的分析生成交互式的基于网络的可视化效果。

https://cdn.ncbi.nlm.nih.gov/pmc/blobs/27b9/5634325/e84cae6f8f96/sdata2017151-f6.jpg
https://cdn.ncbi.nlm.nih.gov/pmc/blobs/27b9/5634325/0bd4c2ffc1ca/sdata2017151-f1.jpg
https://cdn.ncbi.nlm.nih.gov/pmc/blobs/27b9/5634325/28eb200486c0/sdata2017151-f2.jpg
https://cdn.ncbi.nlm.nih.gov/pmc/blobs/27b9/5634325/29690688676e/sdata2017151-f3.jpg
https://cdn.ncbi.nlm.nih.gov/pmc/blobs/27b9/5634325/97f27aecba8c/sdata2017151-f4.jpg
https://cdn.ncbi.nlm.nih.gov/pmc/blobs/27b9/5634325/db5ef0bc4bcb/sdata2017151-f5.jpg
https://cdn.ncbi.nlm.nih.gov/pmc/blobs/27b9/5634325/e84cae6f8f96/sdata2017151-f6.jpg

相似文献

1
Clustergrammer, a web-based heatmap visualization and analysis tool for high-dimensional biological data.Clustergrammer,一个基于网络的高维生物数据热图可视化和分析工具。
Sci Data. 2017 Oct 10;4:170151. doi: 10.1038/sdata.2017.151.
2
BioJupies: Automated Generation of Interactive Notebooks for RNA-Seq Data Analysis in the Cloud.BioJupies:在云端自动生成用于 RNA-Seq 数据分析的交互式笔记本。
Cell Syst. 2018 Nov 28;7(5):556-561.e3. doi: 10.1016/j.cels.2018.10.007. Epub 2018 Nov 14.
3
Appyters: Turning Jupyter Notebooks into data-driven web apps.Appyters:将Jupyter笔记本转变为数据驱动的网络应用程序。
Patterns (N Y). 2021 Mar 4;2(3):100213. doi: 10.1016/j.patter.2021.100213. eCollection 2021 Mar 12.
4
Epiviz Web Components: reusable and extensible component library to visualize functional genomic datasets.Epiviz网络组件:用于可视化功能基因组数据集的可重复使用且可扩展的组件库。
F1000Res. 2018 Jul 17;7:1096. doi: 10.12688/f1000research.15433.1. eCollection 2018.
5
InCHlib - interactive cluster heatmap for web applications.InCHlib - 用于Web应用程序的交互式聚类热图。
J Cheminform. 2014 Sep 17;6(1):44. doi: 10.1186/s13321-014-0044-4. eCollection 2014 Dec.
6
INVEX--a web-based tool for integrative visualization of expression data.INVEX——一个基于网络的用于表达数据综合可视化的工具。
Bioinformatics. 2013 Dec 15;29(24):3232-4. doi: 10.1093/bioinformatics/btt562. Epub 2013 Sep 26.
7
Advances in proteomics data analysis and display using an accurate mass and time tag approach.使用精确质量与时间标签方法进行蛋白质组学数据分析与展示的进展。
Mass Spectrom Rev. 2006 May-Jun;25(3):450-82. doi: 10.1002/mas.20071.
8
HemI 2.0: an online service for heatmap illustration.HemI 2.0:一个用于热图绘制的在线服务。
Nucleic Acids Res. 2022 Jul 5;50(W1):W405-W411. doi: 10.1093/nar/gkac480.
9
A Galaxy Implementation of Next-Generation Clustered Heatmaps for Interactive Exploration of Molecular Profiling Data.用于分子谱数据交互式探索的下一代聚类热图的银河实现。
Cancer Res. 2017 Nov 1;77(21):e23-e26. doi: 10.1158/0008-5472.CAN-17-0318.
10
Fractalis: a scalable open-source service for platform-independent interactive visual analysis of biomedical data.Fractalis:一个可扩展的开源服务,用于在平台独立的情况下对生物医学数据进行交互式可视化分析。
Gigascience. 2018 Sep 1;7(9):giy109. doi: 10.1093/gigascience/giy109.

引用本文的文献

1
Subtype- and race-specific variations in the immune landscape of breast cancer: therapeutic implications.乳腺癌免疫格局中的亚型和种族特异性差异:治疗意义
NPJ Breast Cancer. 2025 Jul 24;11(1):78. doi: 10.1038/s41523-025-00799-8.
2
BSA-LDHs-cGAMP In Situ Sensitization of Osteosarcoma: Enhancing Antitumor Efficacy with CD40 Agonist Antibodies.牛血清白蛋白层状双氢氧化物原位致敏骨肉瘤:用CD40激动剂抗体增强抗肿瘤疗效
ACS Biomater Sci Eng. 2025 Aug 11;11(8):4931-4940. doi: 10.1021/acsbiomaterials.5c00333. Epub 2025 Jul 13.
3
Differential ER stress responses during lactation and postpartum outcomes in mice depending on their mitochondrial genotype.

本文引用的文献

1
shinyheatmap: Ultra fast low memory heatmap web interface for big data genomics.闪亮热图:用于大数据基因组学的超快速低内存热图网络界面。
PLoS One. 2017 May 11;12(5):e0176334. doi: 10.1371/journal.pone.0176334. eCollection 2017.
2
L1000CDS: LINCS L1000 characteristic direction signatures search engine.L1000CDS:连通性图谱L1000特征方向签名搜索引擎。
NPJ Syst Biol Appl. 2016;2:16015-. doi: 10.1038/npjsba.2016.15. Epub 2016 Aug 4.
3
GEN3VA: aggregation and analysis of gene expression signatures from related studies.GEN3VA:相关研究中基因表达特征的汇总与分析
小鼠哺乳期不同的内质网应激反应及其产后结局取决于它们的线粒体基因型。
Nat Commun. 2025 Jul 11;16(1):6432. doi: 10.1038/s41467-025-61666-5.
4
The distinct transcriptomic signature of the resolution phase fibroblast-like synoviocytes supports endothelial cell dysfunction.消退期成纤维细胞样滑膜细胞独特的转录组特征支持内皮细胞功能障碍。
Commun Biol. 2025 May 30;8(1):837. doi: 10.1038/s42003-025-08250-1.
5
IL-7-mediated expansion of autologous lymphocytes increases CD8+ VLA-4 expression and accumulation in glioblastoma models.白细胞介素-7介导的自体淋巴细胞扩增增加了胶质母细胞瘤模型中CD8⁺VLA-4的表达和积累。
J Clin Invest. 2025 Apr 17;135(12). doi: 10.1172/JCI181471. eCollection 2025 Jun 16.
6
Listeria monocytogenes requires phosphotransferase systems to facilitate intracellular growth and virulence.单核细胞增生李斯特菌需要磷酸转移酶系统来促进细胞内生长和毒力。
PLoS Pathog. 2025 Apr 15;21(4):e1012492. doi: 10.1371/journal.ppat.1012492. eCollection 2025 Apr.
7
Adventitial fibroblasts direct smooth muscle cell-state transition in pulmonary vascular disease.外膜成纤维细胞在肺血管疾病中引导平滑肌细胞状态转变。
Elife. 2025 Apr 10;13:RP98558. doi: 10.7554/eLife.98558.
8
Comprehensive Proteomics Metadata and Integrative Web Portals Facilitate Sharing and Integration of LINCS Multiomics Data.综合蛋白质组学元数据和综合网络门户促进了LINCS多组学数据的共享与整合。
Mol Cell Proteomics. 2025 Jul;24(7):100947. doi: 10.1016/j.mcpro.2025.100947. Epub 2025 Mar 13.
9
Combinatorial screen of targeted agents with the PI3K inhibitors inavolisib, alpelisib, duvelisib, and copanlisib in multi-cell type tumor spheroids.在多细胞类型肿瘤球体中,将靶向药物与PI3K抑制剂(依维莫司、阿培利司、度维利塞和库潘尼西)进行组合筛选。
SLAS Discov. 2025 Apr;32:100222. doi: 10.1016/j.slasd.2025.100222. Epub 2025 Feb 23.
10
Plant-nanoparticles enhance anti-PD-L1 efficacy by shaping human commensal microbiota metabolites.植物纳米颗粒通过塑造人体共生微生物群代谢物增强抗PD-L1疗效。
Nat Commun. 2025 Feb 3;16(1):1295. doi: 10.1038/s41467-025-56498-2.
BMC Bioinformatics. 2016 Nov 15;17(1):461. doi: 10.1186/s12859-016-1321-1.
4
Mass cytometry: blessed with the curse of dimensionality.质谱流式细胞术:福兮祸之所伏。
Nat Immunol. 2016 Jul 19;17(8):890-5. doi: 10.1038/ni.3485.
5
Heat*seq: an interactive web tool for high-throughput sequencing experiment comparison with public data.Heat*seq:一个用于将高通量测序实验与公共数据进行比较的交互式网络工具。
Bioinformatics. 2016 Nov 1;32(21):3354-3356. doi: 10.1093/bioinformatics/btw407. Epub 2016 Jul 4.
6
The harmonizome: a collection of processed datasets gathered to serve and mine knowledge about genes and proteins.Harmonizome数据库:一组经过处理的数据集,用于提供和挖掘有关基因和蛋白质的知识。
Database (Oxford). 2016 Jul 3;2016. doi: 10.1093/database/baw100. Print 2016.
7
GEO2Enrichr: browser extension and server app to extract gene sets from GEO and analyze them for biological functions.GEO2Enrichr:用于从基因表达综合数据库(GEO)中提取基因集并分析其生物学功能的浏览器扩展程序和服务器应用程序。
Bioinformatics. 2015 Sep 15;31(18):3060-2. doi: 10.1093/bioinformatics/btv297. Epub 2015 May 13.
8
InCHlib - interactive cluster heatmap for web applications.InCHlib - 用于Web应用程序的交互式聚类热图。
J Cheminform. 2014 Sep 17;6(1):44. doi: 10.1186/s13321-014-0044-4. eCollection 2014 Dec.
9
jHeatmap: an interactive heatmap viewer for the web.jHeatmap:一个用于网页的交互式热图查看器。
Bioinformatics. 2014 Jun 15;30(12):1757-8. doi: 10.1093/bioinformatics/btu094. Epub 2014 Feb 23.
10
viSNE enables visualization of high dimensional single-cell data and reveals phenotypic heterogeneity of leukemia.viSNE 能够可视化高维单细胞数据,并揭示白血病的表型异质性。
Nat Biotechnol. 2013 Jun;31(6):545-52. doi: 10.1038/nbt.2594. Epub 2013 May 19.