• 文献检索
  • 文档翻译
  • 深度研究
  • 学术资讯
  • Suppr Zotero 插件Zotero 插件
  • 邀请有礼
  • 套餐&价格
  • 历史记录
应用&插件
Suppr Zotero 插件Zotero 插件浏览器插件Mac 客户端Windows 客户端微信小程序
定价
高级版会员购买积分包购买API积分包
服务
文献检索文档翻译深度研究API 文档MCP 服务
关于我们
关于 Suppr公司介绍联系我们用户协议隐私条款
关注我们

Suppr 超能文献

核心技术专利:CN118964589B侵权必究
粤ICP备2023148730 号-1Suppr @ 2026

文献检索

告别复杂PubMed语法,用中文像聊天一样搜索,搜遍4000万医学文献。AI智能推荐,让科研检索更轻松。

立即免费搜索

文件翻译

保留排版,准确专业,支持PDF/Word/PPT等文件格式,支持 12+语言互译。

免费翻译文档

深度研究

AI帮你快速写综述,25分钟生成高质量综述,智能提取关键信息,辅助科研写作。

立即免费体验

CGDV:一个用于基因组学和转录组学数据环形可视化的网络工具。

CGDV: a webtool for circular visualization of genomics and transcriptomics data.

机构信息

Labs, Persistent Systems Limited, Pingala - Aryabhata, Erandwane, Pune, 411004, India.

Present address: Bioinformatics Center, Pune University, Ganeshkhind, Pune, Maharashtra, 411007, India.

出版信息

BMC Genomics. 2017 Oct 24;18(1):823. doi: 10.1186/s12864-017-4169-5.

DOI:10.1186/s12864-017-4169-5
PMID:29065857
原文链接:https://pmc.ncbi.nlm.nih.gov/articles/PMC5655900/
Abstract

BACKGROUND

Interpretation of large-scale data is very challenging and currently there is scarcity of web tools which support automated visualization of a variety of high throughput genomics and transcriptomics data and for a wide variety of model organisms along with user defined karyotypes. Circular plot provides holistic visualization of high throughput large scale data but it is very complex and challenging to generate as most of the available tools need informatics expertise to install and run them.

RESULT

We have developed CGDV (Circos for Genomics and Transcriptomics Data Visualization), a webtool based on Circos, for seamless and automated visualization of a variety of large scale genomics and transcriptomics data. CGDV takes output of analyzed genomics or transcriptomics data of different formats, such as vcf, bed, xls, tab limited matrix text file, CNVnator raw output and Gene fusion raw output, to plot circular view of the sample data. CGDV take cares of generating intermediate files required for circos. CGDV is freely available at https://cgdv-upload.persistent.co.in/cgdv/ .

CONCLUSION

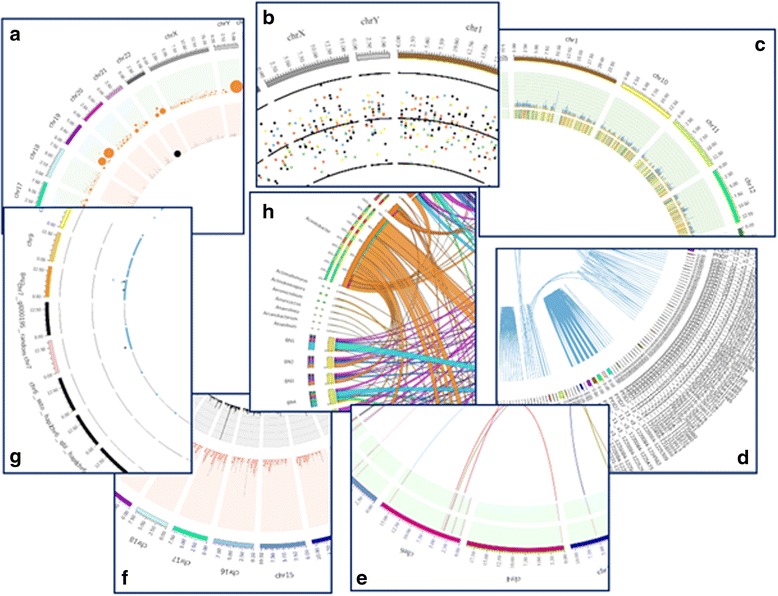
The circular plot for each data type is tailored to gain best biological insights into the data. The inter-relationship between data points, homologous sequences, genes involved in fusion events, differential expression pattern, sequencing depth, types and size of variations and enrichment of DNA binding proteins can be seen using CGDV. CGDV thus helps biologists and bioinformaticians to visualize a variety of genomics and transcriptomics data seamlessly.

摘要

背景

大规模数据的解读极具挑战性,目前缺乏支持自动化可视化各种高通量基因组学和转录组学数据的网络工具,也无法针对各种模式生物以及用户定义的核型进行可视化。环形图提供了高通量大数据的整体可视化,但由于大多数可用工具需要计算专业知识来安装和运行,因此生成它非常复杂且具有挑战性。

结果

我们开发了 CGDV(基于 Circos 的基因组学和转录组学数据可视化工具),这是一个基于 Circos 的网络工具,用于无缝和自动化地可视化各种大规模基因组学和转录组学数据。CGDV 接受不同格式的分析基因组学或转录组学数据的输出,例如 vcf、bed、xls、制表符限制矩阵文本文件、CNVnator 原始输出和基因融合原始输出,以绘制样本数据的环形视图。CGDV 负责生成 Circos 所需的中间文件。CGDV 可在 https://cgdv-upload.persistent.co.in/cgdv/ 免费获得。

结论

针对每种数据类型的环形图都经过精心设计,以最大程度地深入了解数据的生物学特性。使用 CGDV 可以看到数据点、同源序列、融合事件中涉及的基因、差异表达模式、测序深度、变异的类型和大小以及 DNA 结合蛋白的富集之间的相互关系。因此,CGDV 有助于生物学家和生物信息学家无缝地可视化各种基因组学和转录组学数据。

https://cdn.ncbi.nlm.nih.gov/pmc/blobs/2f94/5655900/b0cbbb901d44/12864_2017_4169_Fig1_HTML.jpg

相似文献

1
CGDV: a webtool for circular visualization of genomics and transcriptomics data.CGDV:一个用于基因组学和转录组学数据环形可视化的网络工具。
BMC Genomics. 2017 Oct 24;18(1):823. doi: 10.1186/s12864-017-4169-5.
2
CircosVCF: circos visualization of whole-genome sequence variations stored in VCF files.CircosVCF:VCF文件中存储的全基因组序列变异的Circos可视化。
Bioinformatics. 2017 May 1;33(9):1392-1393. doi: 10.1093/bioinformatics/btw834.
3
Interactive Browser-Based Genomics Data Visualization Tools for Translational and Clinical Laboratory Applications.交互式基于浏览器的基因组学数据可视化工具,用于转化和临床实验室应用。
J Mol Diagn. 2019 Nov;21(6):985-993. doi: 10.1016/j.jmoldx.2019.06.005. Epub 2019 Aug 2.
4
Seamless integration of image and molecular analysis for spatial transcriptomics workflows.用于空间转录组学工作流程的图像与分子分析的无缝整合。
BMC Genomics. 2020 Jul 14;21(1):482. doi: 10.1186/s12864-020-06832-3.
5
shinyCircos: an R/Shiny application for interactive creation of Circos plot.shinyCircos:一个用于交互式创建 Circos 图的 R/Shiny 应用程序。
Bioinformatics. 2018 Apr 1;34(7):1229-1231. doi: 10.1093/bioinformatics/btx763.
6
Galactic Circos: User-friendly Circos plots within the Galaxy platform.银河 Circos:Galaxy 平台内用户友好的 Circos 图。
Gigascience. 2020 Jun 1;9(6). doi: 10.1093/gigascience/giaa065.
7
SaVanT: a web-based tool for the sample-level visualization of molecular signatures in gene expression profiles.SaVanT:一个基于网络的工具,用于在基因表达谱中对分子特征进行样本级可视化。
BMC Genomics. 2017 Oct 25;18(1):824. doi: 10.1186/s12864-017-4167-7.
8
NASQAR: a web-based platform for high-throughput sequencing data analysis and visualization.NASQAR:一个用于高通量测序数据分析和可视化的基于网络的平台。
BMC Bioinformatics. 2020 Jun 29;21(1):267. doi: 10.1186/s12859-020-03577-4.
9
CANEapp: a user-friendly application for automated next generation transcriptomic data analysis.CANEapp:一款用于自动化下一代转录组数据分析的用户友好型应用程序。
BMC Genomics. 2016 Jan 13;17:49. doi: 10.1186/s12864-015-2346-y.
10
J-Circos: an interactive Circos plotter.J-Circos:一个交互式 Circos 绘图工具。
Bioinformatics. 2015 May 1;31(9):1463-5. doi: 10.1093/bioinformatics/btu842. Epub 2014 Dec 24.

引用本文的文献

1
Visual Integration of Genome-Wide Association Studies and Differential Expression Results with the Hidecan R Package.使用 Hidecan R 包进行全基因组关联研究和差异表达结果的可视化整合。
Genes (Basel). 2024 Sep 25;15(10):1244. doi: 10.3390/genes15101244.
2
Bioinformatics Analysis and Validation of Potential Markers Associated with Prediction and Prognosis of Gastric Cancer.生物信息学分析和验证与胃癌预测和预后相关的潜在标志物。
Int J Mol Sci. 2024 May 28;25(11):5880. doi: 10.3390/ijms25115880.
3
Multi-omics Data Integration, Interpretation, and Its Application.

本文引用的文献

1
ClicO FS: an interactive web-based service of Circos.ClicO FS:Circos 的一个交互式网络服务。
Bioinformatics. 2015 Nov 15;31(22):3685-7. doi: 10.1093/bioinformatics/btv433. Epub 2015 Jul 29.
2
CiVi: circular genome visualization with unique features to analyze sequence elements.CiVi:具有独特功能的环状基因组可视化工具,用于分析序列元件。
Bioinformatics. 2015 Sep 1;31(17):2867-9. doi: 10.1093/bioinformatics/btv249. Epub 2015 Apr 24.
3
J-Circos: an interactive Circos plotter.J-Circos:一个交互式 Circos 绘图工具。
多组学数据整合、解读及其应用
Bioinform Biol Insights. 2020 Jan 31;14:1177932219899051. doi: 10.1177/1177932219899051. eCollection 2020.
4
Overview of Genomic Tools for Circular Visualization in the Next-generation Genomic Sequencing Era.下一代基因组测序时代用于环形可视化的基因组工具概述
Curr Genomics. 2019 Feb;20(2):90-99. doi: 10.2174/1389202920666190314092044.
Bioinformatics. 2015 May 1;31(9):1463-5. doi: 10.1093/bioinformatics/btu842. Epub 2014 Dec 24.
4
CNVnator: an approach to discover, genotype, and characterize typical and atypical CNVs from family and population genome sequencing.CNVnator:一种从家族和人群基因组测序中发现、基因分型和表征典型和非典型 CNV 的方法。
Genome Res. 2011 Jun;21(6):974-84. doi: 10.1101/gr.114876.110. Epub 2011 Feb 7.
5
Transcript assembly and quantification by RNA-Seq reveals unannotated transcripts and isoform switching during cell differentiation.通过 RNA-Seq 进行转录本组装和定量分析揭示了细胞分化过程中未注释的转录本和异构体转换。
Nat Biotechnol. 2010 May;28(5):511-5. doi: 10.1038/nbt.1621. Epub 2010 May 2.
6
Circos: an information aesthetic for comparative genomics.Circos:一种用于比较基因组学的信息美学。
Genome Res. 2009 Sep;19(9):1639-45. doi: 10.1101/gr.092759.109. Epub 2009 Jun 18.
7
Model-based analysis of ChIP-Seq (MACS).基于模型的染色质免疫沉淀测序分析(MACS)
Genome Biol. 2008;9(9):R137. doi: 10.1186/gb-2008-9-9-r137. Epub 2008 Sep 17.
8
Basic local alignment search tool.基本局部比对搜索工具
J Mol Biol. 1990 Oct 5;215(3):403-10. doi: 10.1016/S0022-2836(05)80360-2.