Hummel Manuela, Edelmann Dominic, Kopp-Schneider Annette
Division of Biostatistics, German Cancer Research Center, Heidelberg, Germany.
PLoS One. 2017 Nov 28;12(11):e0188274. doi: 10.1371/journal.pone.0188274. eCollection 2017.
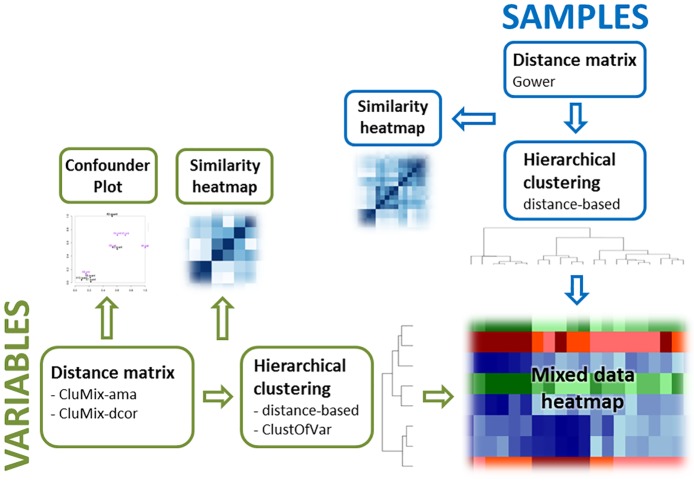
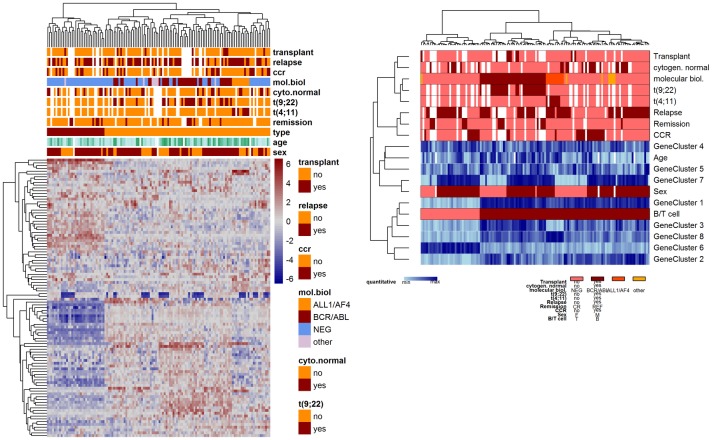
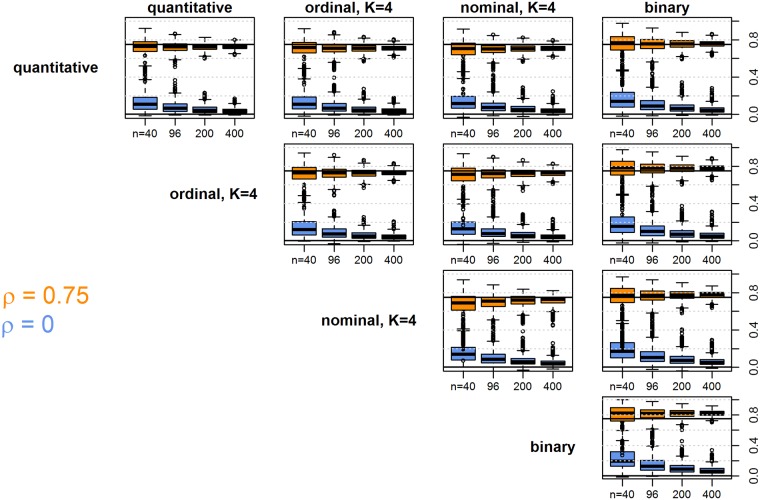
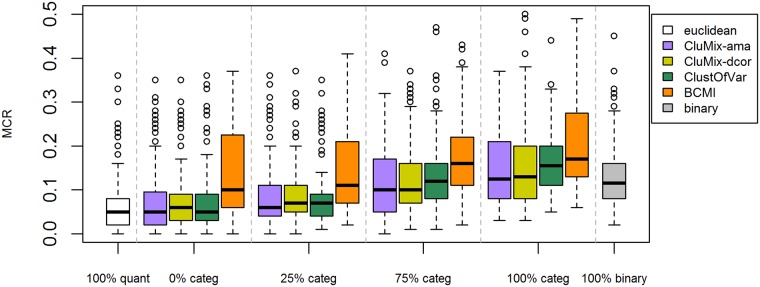
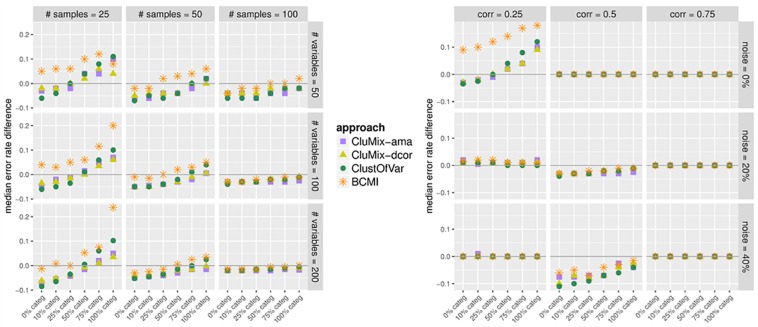
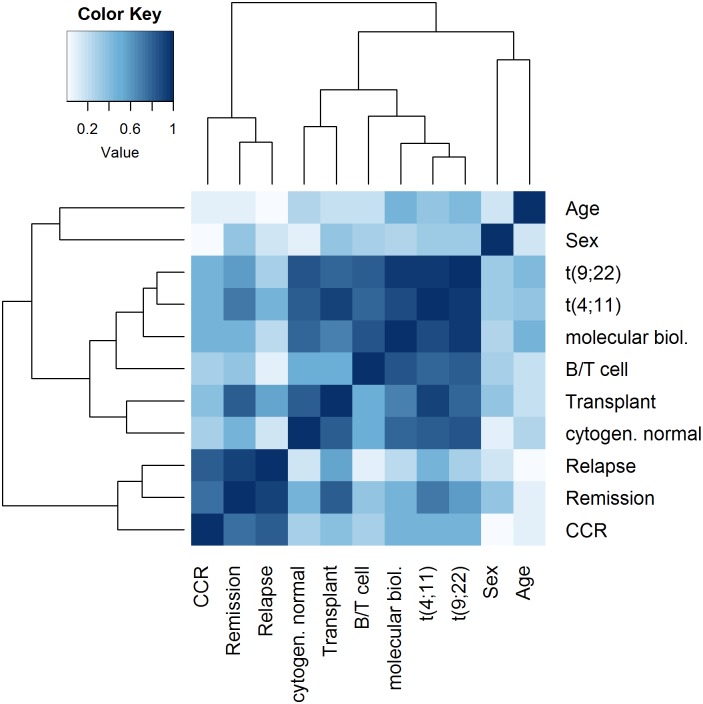
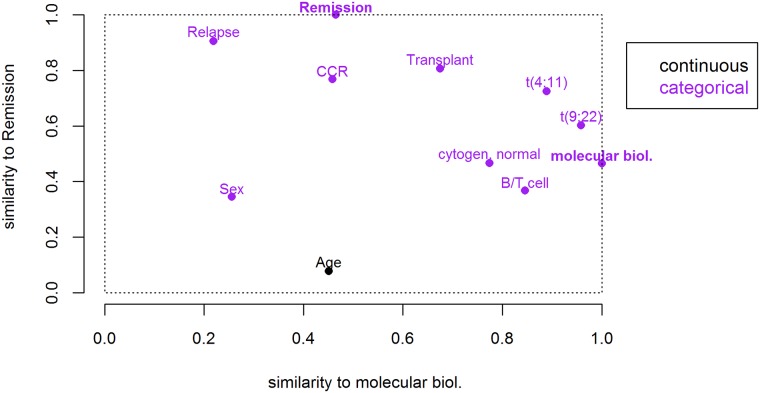
Analysis of data measured on different scales is a relevant challenge. Biomedical studies often focus on high-throughput datasets of, e.g., quantitative measurements. However, the need for integration of other features possibly measured on different scales, e.g. clinical or cytogenetic factors, becomes increasingly important. The analysis results (e.g. a selection of relevant genes) are then visualized, while adding further information, like clinical factors, on top. However, a more integrative approach is desirable, where all available data are analyzed jointly, and where also in the visualization different data sources are combined in a more natural way. Here we specifically target integrative visualization and present a heatmap-style graphic display. To this end, we develop and explore methods for clustering mixed-type data, with special focus on clustering variables. Clustering of variables does not receive as much attention in the literature as does clustering of samples. We extend the variables clustering methodology by two new approaches, one based on the combination of different association measures and the other on distance correlation. With simulation studies we evaluate and compare different clustering strategies. Applying specific methods for mixed-type data proves to be comparable and in many cases beneficial as compared to standard approaches applied to corresponding quantitative or binarized data. Our two novel approaches for mixed-type variables show similar or better performance than the existing methods ClustOfVar and bias-corrected mutual information. Further, in contrast to ClustOfVar, our methods provide dissimilarity matrices, which is an advantage, especially for the purpose of visualization. Real data examples aim to give an impression of various kinds of potential applications for the integrative heatmap and other graphical displays based on dissimilarity matrices. We demonstrate that the presented integrative heatmap provides more information than common data displays about the relationship among variables and samples. The described clustering and visualization methods are implemented in our R package CluMix available from https://cran.r-project.org/web/packages/CluMix.
对不同尺度上测量的数据进行分析是一项颇具挑战性的任务。生物医学研究通常聚焦于高通量数据集,例如定量测量数据。然而,整合可能在不同尺度上测量的其他特征(例如临床或细胞遗传学因素)的需求变得越来越重要。然后将分析结果(例如相关基因的选择)进行可视化展示,同时在其上添加更多信息,如临床因素。然而,一种更具综合性的方法是可取的,即联合分析所有可用数据,并且在可视化过程中以更自然的方式组合不同的数据源。在此,我们专门针对整合可视化并提出一种热图样式的图形显示。为此,我们开发并探索用于混合类型数据聚类的方法,特别关注变量聚类。变量聚类在文献中受到的关注不如样本聚类。我们通过两种新方法扩展了变量聚类方法,一种基于不同关联度量的组合,另一种基于距离相关性。通过模拟研究,我们评估并比较了不同的聚类策略。与应用于相应定量或二值化数据的标准方法相比,应用针对混合类型数据的特定方法被证明具有可比性,并且在许多情况下更具优势。我们针对混合类型变量的两种新方法表现出与现有方法ClustOfVar和偏差校正互信息相似或更好的性能。此外,与ClustOfVar不同,我们的方法提供了差异矩阵,这是一个优势,特别是对于可视化目的而言。实际数据示例旨在展示整合热图和基于差异矩阵的其他图形显示的各种潜在应用。我们证明,所呈现的整合热图比常见的数据显示提供了更多关于变量和样本之间关系的信息。所描述的聚类和可视化方法在我们的R包CluMix中实现,可从https://cran.r-project.org/web/packages/CluMix获取。