Department of Radiation Oncology, The University of Texas MD Anderson Cancer Center, Houston, Texas.
Department of Pathology, The University of Texas MD Anderson Cancer Center, Houston, Texas.
Cancer. 2018 Apr 15;124(8):1701-1709. doi: 10.1002/cncr.31251. Epub 2018 Jan 25.
The assessment of pancreatic ductal adenocarcinoma (PDAC) response to therapy remains challenging. The objective of this study was to investigate whether changes in the tumor/parenchyma interface are associated with response.
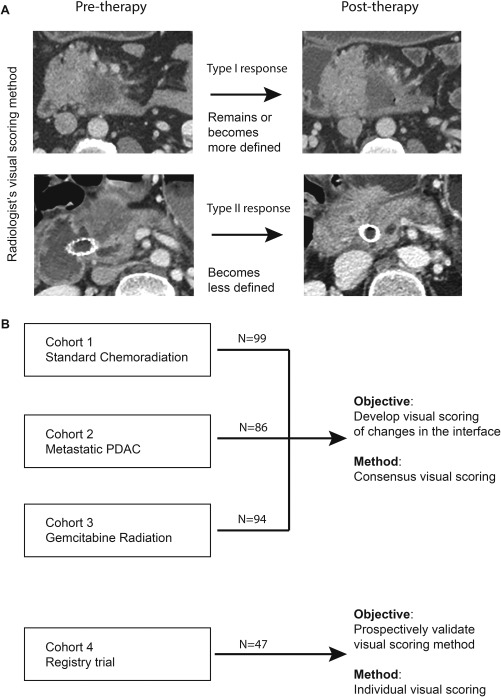
Computed tomography (CT) scans before and after therapy were reviewed in 4 cohorts: cohort 1 (99 patients with stage I/II PDAC who received neoadjuvant chemoradiation and surgery); cohort 2 (86 patients with stage IV PDAC who received chemotherapy), cohort 3 (94 patients with stage I/II PDAC who received protocol-based neoadjuvant gemcitabine chemoradiation), and cohort 4 (47 patients with stage I/II PDAC who received neoadjuvant chemoradiation and were prospectively followed in a registry). The tumor/parenchyma interface was visually classified as either a type I response (the interface remained or became well defined) or a type II response (the interface became poorly defined) after therapy. Consensus (cohorts 1-3) and individual (cohort 4) visual scoring was performed. Changes in enhancement at the interface were quantified using a proprietary platform.
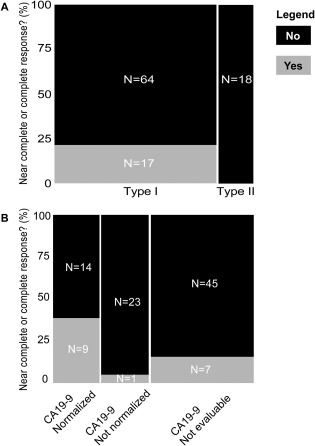
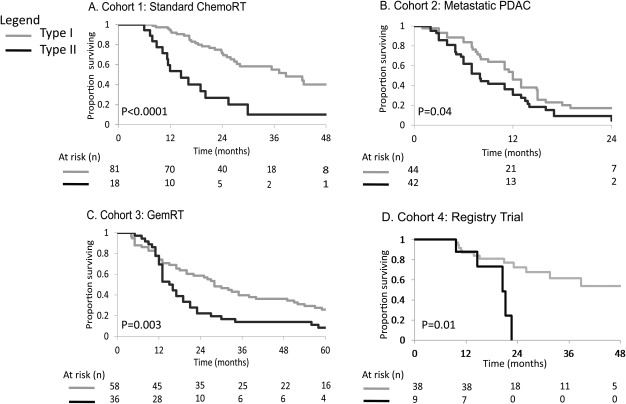
In cohort 1, type I responders had a greater probability of achieving a complete or near-complete pathologic response (21% vs 0%; P = .01). For cohorts 1, 2, and 3, type I responders had significantly longer disease-free and overall survival, independent of traditional covariates of outcomes and of baseline and normalized cancer antigen 19-9 levels. In cohort 4, 2 senior radiologists achieved a κ value of 0.8, and the interface score was associated with overall survival. The quantitative method revealed high specificity and sensitivity in classifying patients as type I or type II responders (with an area under the receiver operating curve of 0.92 in cohort 1, 0.96 in cohort 2, and 0.89 in cohort 3).
Changes at the PDAC/parenchyma interface may serve as an early predictor of response to therapy. Cancer 2018;124:1701-9. © 2018 The Authors. Cancer published by Wiley Periodicals, Inc. on behalf of American Cancer Society. This is an open access article under the terms of the Creative Commons Attribution-NonCommercial-NoDerivs License, which permits use and distribution in any medium, provided the original work is properly cited, the use is non-commercial and no modifications or adaptations are made.
对胰腺导管腺癌(PDAC)治疗反应的评估仍然具有挑战性。本研究的目的是探讨肿瘤/实质界面的变化是否与反应相关。
在 4 个队列中回顾了治疗前后的计算机断层扫描(CT)扫描:队列 1(99 例接受新辅助放化疗和手术的 I/II 期 PDAC 患者);队列 2(86 例接受化疗的 IV 期 PDAC 患者);队列 3(94 例接受基于方案的新辅助吉西他滨放化疗的 I/II 期 PDAC 患者);队列 4(47 例接受新辅助放化疗并在登记处前瞻性随访的 I/II 期 PDAC 患者)。在治疗后,肿瘤/实质界面通过视觉分类为 I 型反应(界面保持或变得明确)或 II 型反应(界面变得不明确)。进行了共识(队列 1-3)和个体(队列 4)的视觉评分。使用专有的平台量化界面处增强的变化。
在队列 1 中,I 型反应者有更大的可能性实现完全或接近完全的病理反应(21%比 0%;P =.01)。对于队列 1、2 和 3,I 型反应者具有显著更长的无病和总体生存,独立于结局的传统预后因素以及基线和标准化的癌抗原 19-9 水平。在队列 4 中,2 位资深放射科医生的κ 值为 0.8,界面评分与总体生存相关。定量方法在将患者分类为 I 型或 II 型反应者方面具有很高的特异性和敏感性(在队列 1 中的受试者工作特征曲线下面积为 0.92,在队列 2 中的面积为 0.96,在队列 3 中的面积为 0.89)。
PDAC/实质界面的变化可能成为治疗反应的早期预测指标。癌症 2018;124:1701-9。© 2018 美国癌症协会。这是在知识共享署名-非商业性-禁止演绎许可协议下发布的作品,允许在任何媒体上发布、复制、改编、分发和表演,前提是注明原始作者和来源。