• 文献检索
  • 文档翻译
  • 深度研究
  • 学术资讯
  • Suppr Zotero 插件Zotero 插件
  • 邀请有礼
  • 套餐&价格
  • 历史记录
应用&插件
Suppr Zotero 插件Zotero 插件浏览器插件Mac 客户端Windows 客户端微信小程序
定价
高级版会员购买积分包购买API积分包
服务
文献检索文档翻译深度研究API 文档MCP 服务
关于我们
关于 Suppr公司介绍联系我们用户协议隐私条款
关注我们

Suppr 超能文献

核心技术专利:CN118964589B侵权必究
粤ICP备2023148730 号-1Suppr @ 2026

文献检索

告别复杂PubMed语法,用中文像聊天一样搜索,搜遍4000万医学文献。AI智能推荐,让科研检索更轻松。

立即免费搜索

文件翻译

保留排版,准确专业,支持PDF/Word/PPT等文件格式,支持 12+语言互译。

免费翻译文档

深度研究

AI帮你快速写综述,25分钟生成高质量综述,智能提取关键信息,辅助科研写作。

立即免费体验

五种测量乳腺密度方法的比较:病例对照研究。

A comparison of five methods of measuring mammographic density: a case-control study.

机构信息

Division of Informatics, Imaging and Data Sciences, Faculty of Biology, Medicine and Health, University of Manchester, Manchester Academic Health Science Centre, Stopford Building, Oxford Road, Manchester, M13 9PT, UK.

Prevent Breast Cancer and Nightingale Breast Screening Centre, Manchester University NHS Foundation Trust, Manchester Academic Health Science Centre, Southmoor Road, Wythenshawe, Manchester, M23 9LT, UK.

出版信息

Breast Cancer Res. 2018 Feb 5;20(1):10. doi: 10.1186/s13058-018-0932-z.

DOI:10.1186/s13058-018-0932-z
PMID:29402289
原文链接:https://pmc.ncbi.nlm.nih.gov/articles/PMC5799922/
Abstract

BACKGROUND

High mammographic density is associated with both risk of cancers being missed at mammography, and increased risk of developing breast cancer. Stratification of breast cancer prevention and screening requires mammographic density measures predictive of cancer. This study compares five mammographic density measures to determine the association with subsequent diagnosis of breast cancer and the presence of breast cancer at screening.

METHODS

Women participating in the "Predicting Risk Of Cancer At Screening" (PROCAS) study, a study of cancer risk, completed questionnaires to provide personal information to enable computation of the Tyrer-Cuzick risk score. Mammographic density was assessed by visual analogue scale (VAS), thresholding (Cumulus) and fully-automated methods (Densitas, Quantra, Volpara) in contralateral breasts of 366 women with unilateral breast cancer (cases) detected at screening on entry to the study (Cumulus 311/366) and in 338 women with cancer detected subsequently. Three controls per case were matched using age, body mass index category, hormone replacement therapy use and menopausal status. Odds ratios (OR) between the highest and lowest quintile, based on the density distribution in controls, for each density measure were estimated by conditional logistic regression, adjusting for classic risk factors.

RESULTS

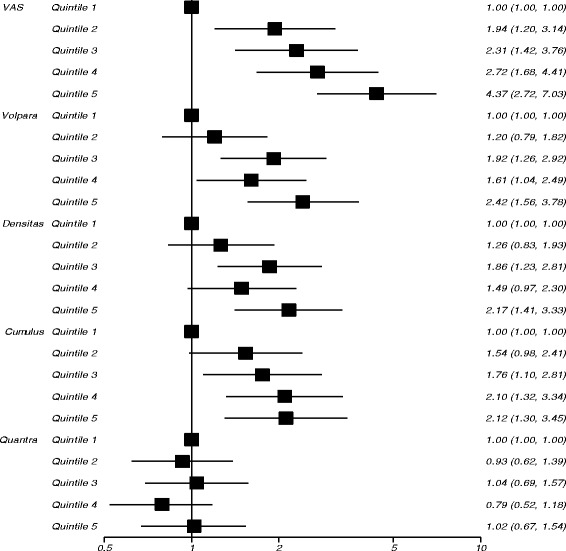
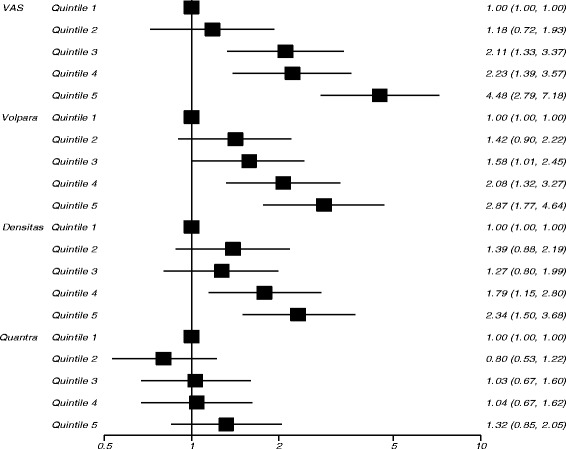
The strongest predictor of screen-detected cancer at study entry was VAS, OR 4.37 (95% CI 2.72-7.03) in the highest vs lowest quintile of percent density after adjustment for classical risk factors. Volpara, Densitas and Cumulus gave ORs for the highest vs lowest quintile of 2.42 (95% CI 1.56-3.78), 2.17 (95% CI 1.41-3.33) and 2.12 (95% CI 1.30-3.45), respectively. Quantra was not significantly associated with breast cancer (OR 1.02, 95% CI 0.67-1.54). Similar results were found for subsequent cancers, with ORs of 4.48 (95% CI 2.79-7.18), 2.87 (95% CI 1.77-4.64) and 2.34 (95% CI 1.50-3.68) in highest vs lowest quintiles of VAS, Volpara and Densitas, respectively. Quantra gave an OR in the highest vs lowest quintile of 1.32 (95% CI 0.85-2.05).

CONCLUSIONS

Visual density assessment demonstrated a strong relationship with cancer, despite known inter-observer variability; however, it is impractical for population-based screening. Percentage density measured by Volpara and Densitas also had a strong association with breast cancer risk, amongst the automated measures evaluated, providing practical automated methods for risk stratification.

摘要

背景

高乳房密度与乳房 X 光检查中漏诊癌症的风险以及乳腺癌发病风险增加有关。乳腺癌预防和筛查的分层需要预测癌症的乳房密度测量。本研究比较了五种乳房密度测量方法,以确定与随后的乳腺癌诊断和筛查时乳腺癌存在的关联。

方法

参加“预测筛查时癌症风险”(PROCAS)研究的女性完成了问卷调查,提供个人信息,以便计算 Tyrer-Cuzick 风险评分。在研究入组时,通过视觉模拟量表(VAS)、阈值(Cumulus)和全自动方法(Densitas、Quantra、Volpara)对 366 名单侧乳腺癌(病例)患者的对侧乳房进行了评估,其中 311/366 名患者在筛查中发现乳腺癌,338 名患者随后发现癌症。每例病例匹配 3 名年龄、体重指数类别、激素替代疗法使用和绝经状态匹配的对照。使用控制变量逻辑回归,根据对照中密度分布,对每个密度测量的最高和最低五分位数进行调整,以估计经典风险因素后,每个密度测量的优势比(OR)。

结果

在研究入组时,VAS 是筛查发现癌症的最强预测因子,与最低五分位数相比,最高五分位数的 OR 为 4.37(95%CI 2.72-7.03),经经典风险因素调整后。与最低五分位数相比,Volpara、Densitas 和 Cumulus 的最高五分位数的 OR 分别为 2.42(95%CI 1.56-3.78)、2.17(95%CI 1.41-3.33)和 2.12(95%CI 1.30-3.45)。Quantra 与乳腺癌无显著相关性(OR 1.02,95%CI 0.67-1.54)。对于随后的癌症,VAS、Volpara 和 Densitas 的最高五分位数与最低五分位数的 OR 分别为 4.48(95%CI 2.79-7.18)、2.87(95%CI 1.77-4.64)和 2.34(95%CI 1.50-3.68),结果相似。与最低五分位数相比,Quantra 的最高五分位数的 OR 为 1.32(95%CI 0.85-2.05)。

结论

尽管存在已知的观察者间变异性,但视觉密度评估与癌症有很强的关系;然而,它不适用于基于人群的筛查。Volpara 和 Densitas 测量的百分比密度也与乳腺癌风险有很强的关联,在评估的自动化方法中,为风险分层提供了实用的自动化方法。

https://cdn.ncbi.nlm.nih.gov/pmc/blobs/0591/5799922/8cf606c8df6e/13058_2018_932_Fig2_HTML.jpg
https://cdn.ncbi.nlm.nih.gov/pmc/blobs/0591/5799922/af863ee2b89d/13058_2018_932_Fig1_HTML.jpg
https://cdn.ncbi.nlm.nih.gov/pmc/blobs/0591/5799922/8cf606c8df6e/13058_2018_932_Fig2_HTML.jpg
https://cdn.ncbi.nlm.nih.gov/pmc/blobs/0591/5799922/af863ee2b89d/13058_2018_932_Fig1_HTML.jpg
https://cdn.ncbi.nlm.nih.gov/pmc/blobs/0591/5799922/8cf606c8df6e/13058_2018_932_Fig2_HTML.jpg

相似文献

1
A comparison of five methods of measuring mammographic density: a case-control study.五种测量乳腺密度方法的比较:病例对照研究。
Breast Cancer Res. 2018 Feb 5;20(1):10. doi: 10.1186/s13058-018-0932-z.
2
Mammographic breast density and breast cancer risk in the Saudi population: a case-control study using visual and automated methods.沙特人群中乳腺钼靶密度与乳腺癌风险:一项采用视觉和自动方法的病例对照研究。
Br J Radiol. 2022 Jun 1;95(1134):20211197. doi: 10.1259/bjr.20211197. Epub 2022 Mar 9.
3
Mammographic density and breast cancer risk in breast screening assessment cases and women with a family history of breast cancer.乳腺筛查评估病例和有乳腺癌家族史的女性的乳腺密度与乳腺癌风险。
Eur J Cancer. 2018 Jan;88:48-56. doi: 10.1016/j.ejca.2017.10.022. Epub 2017 Nov 27.
4
Predicting interval and screen-detected breast cancers from mammographic density defined by different brightness thresholds.根据不同亮度阈值定义的乳腺密度预测间期和筛查性乳腺癌。
Breast Cancer Res. 2018 Dec 13;20(1):152. doi: 10.1186/s13058-018-1081-0.
5
Long-term Accuracy of Breast Cancer Risk Assessment Combining Classic Risk Factors and Breast Density.经典风险因素与乳腺密度相结合的乳腺癌风险评估的长期准确性。
JAMA Oncol. 2018 Sep 1;4(9):e180174. doi: 10.1001/jamaoncol.2018.0174. Epub 2018 Sep 13.
6
Digital mammographic density and breast cancer risk: a case-control study of six alternative density assessment methods.数字化乳腺密度与乳腺癌风险:六种替代密度评估方法的病例对照研究
Breast Cancer Res. 2014 Sep 20;16(5):439. doi: 10.1186/s13058-014-0439-1.
7
AutoDensity: an automated method to measure mammographic breast density that predicts breast cancer risk and screening outcomes.自动密度:一种测量乳腺钼靶密度的自动化方法,可预测乳腺癌风险和筛查结果。
Breast Cancer Res. 2013;15(5):R80. doi: 10.1186/bcr3474.
8
Comparison of Clinical and Automated Breast Density Measurements: Implications for Risk Prediction and Supplemental Screening.临床与自动乳腺密度测量的比较:对风险预测和补充筛查的意义。
Radiology. 2016 Jun;279(3):710-9. doi: 10.1148/radiol.2015151261. Epub 2015 Dec 22.
9
Risk factors and tumor characteristics of interval cancers by mammographic density.基于乳腺密度的间隔期癌症的风险因素和肿瘤特征。
J Clin Oncol. 2015 Mar 20;33(9):1030-7. doi: 10.1200/JCO.2014.58.9986. Epub 2015 Feb 2.
10
Breast Cancer Risk and Mammographic Density Assessed with Semiautomated and Fully Automated Methods and BI-RADS.采用半自动和全自动方法及乳腺影像报告和数据系统(BI-RADS)评估乳腺癌风险和乳腺钼靶密度
Radiology. 2017 Feb;282(2):348-355. doi: 10.1148/radiol.2016152062. Epub 2016 Sep 5.

引用本文的文献

1
Differentiating Breast Tissue Stiffness With Magnetic Resonance Elastography (MRE): A Focus on Fibroglandular and Fatty Tissues.利用磁共振弹性成像(MRE)鉴别乳腺组织硬度:聚焦于纤维腺组织和脂肪组织
NMR Biomed. 2025 Oct;38(10):e70134. doi: 10.1002/nbm.70134.
2
Challenges and opportunities for Aotearoa/New Zealand's breast screening programme.新西兰奥特亚罗瓦地区乳房筛查计划面临的挑战与机遇。
J R Soc N Z. 2025 Feb 18;55(5):1295-1303. doi: 10.1080/03036758.2025.2463448. eCollection 2025.
3
Comparing percent breast density assessments of an AI-based method with expert reader estimates: inter-observer variability.

本文引用的文献

1
Breast Tissue Organisation and its Association with Breast Cancer Risk.乳腺组织及其与乳腺癌风险的关联。
Breast Cancer Res. 2017 Sep 6;19(1):103. doi: 10.1186/s13058-017-0894-6.
2
Mammographic texture and risk of breast cancer by tumor type and estrogen receptor status.乳腺钼靶纹理与不同肿瘤类型及雌激素受体状态的乳腺癌风险
Breast Cancer Res. 2016 Dec 6;18(1):122. doi: 10.1186/s13058-016-0778-1.
3
Unsupervised Deep Learning Applied to Breast Density Segmentation and Mammographic Risk Scoring.无监督深度学习在乳腺密度分割和乳腺钼靶风险评分中的应用。
比较基于人工智能的方法与专家阅片者估计的乳腺密度百分比评估:观察者间的变异性。
J Med Imaging (Bellingham). 2025 Nov;12(Suppl 2):S22011. doi: 10.1117/1.JMI.12.S2.S22011. Epub 2025 Jun 12.
4
Identifying breast cancer risk factors and evaluating biennial mammography screening efficacy using big data analysis in Taiwan.利用大数据分析识别台湾地区乳腺癌风险因素并评估两年一次的乳房X光检查筛查效果。
Sci Rep. 2025 May 9;15(1):16250. doi: 10.1038/s41598-025-00984-6.
5
Circulating sex hormones and volumetric breast density: A prospective study in women from the EPIC Florence cohort.循环性激素与乳腺体积密度:对EPIC佛罗伦萨队列女性的前瞻性研究
Int J Cancer. 2025 Jun 15;156(12):2294-2302. doi: 10.1002/ijc.35321. Epub 2024 Dec 29.
6
Machine Learning-Based Approaches for Breast Density Estimation from Mammograms: A Comprehensive Review.基于机器学习的乳腺钼靶图像乳腺密度估计方法:综述
J Imaging. 2025 Jan 26;11(2):38. doi: 10.3390/jimaging11020038.
7
Concordant and discordant breast density patterns by different approaches for assessing breast density and breast cancer risk.通过不同方法评估乳腺密度和乳腺癌风险时的一致和不一致乳腺密度模式。
Breast Cancer Res Treat. 2025 Feb;210(1):105-114. doi: 10.1007/s10549-024-07541-1. Epub 2024 Nov 1.
8
Current status and prospects of breast cancer imaging-based diagnosis using artificial intelligence.基于人工智能的乳腺癌影像学诊断的现状与展望。
Int J Clin Oncol. 2024 Nov;29(11):1641-1647. doi: 10.1007/s10147-024-02594-0. Epub 2024 Sep 19.
9
Overcoming challenges in conducting early phase breast cancer prevention trials: Bazedoxifene and conjugated estrogens vs waitlist control.克服早期乳腺癌预防试验中的挑战:巴多昔芬和结合雌激素与安慰剂对照。
Contemp Clin Trials. 2024 Nov;146:107697. doi: 10.1016/j.cct.2024.107697. Epub 2024 Sep 17.
10
Relationship between Volpara Density Grade and Compressed Breast Thickness in Japanese Patients with Breast Cancer.日本乳腺癌患者中Volpara密度分级与乳房压缩厚度之间的关系。
Diagnostics (Basel). 2024 Jul 31;14(15):1651. doi: 10.3390/diagnostics14151651.
IEEE Trans Med Imaging. 2016 May;35(5):1322-1331. doi: 10.1109/TMI.2016.2532122. Epub 2016 Feb 18.
4
Mammographic density adds accuracy to both the Tyrer-Cuzick and Gail breast cancer risk models in a prospective UK screening cohort.在英国一个前瞻性筛查队列中,乳腺X线密度提高了泰勒-库齐克模型和盖尔乳腺癌风险模型的准确性。
Breast Cancer Res. 2015 Dec 1;17(1):147. doi: 10.1186/s13058-015-0653-5.
5
Breast cancer risk analysis based on a novel segmentation framework for digital mammograms.基于数字乳腺X线摄影新型分割框架的乳腺癌风险分析
Med Image Comput Comput Assist Interv. 2014;17(Pt 1):536-43. doi: 10.1007/978-3-319-10404-1_67.
6
A concordance index for matched case-control studies with applications in cancer risk.用于匹配病例对照研究的一致性指数及其在癌症风险中的应用。
Stat Med. 2015 Feb 10;34(3):396-405. doi: 10.1002/sim.6335. Epub 2014 Oct 16.
7
Digital mammographic density and breast cancer risk: a case-control study of six alternative density assessment methods.数字化乳腺密度与乳腺癌风险:六种替代密度评估方法的病例对照研究
Breast Cancer Res. 2014 Sep 20;16(5):439. doi: 10.1186/s13058-014-0439-1.
8
Mammographic density phenotypes and risk of breast cancer: a meta-analysis.乳腺密度表型与乳腺癌风险:荟萃分析。
J Natl Cancer Inst. 2014 May 10;106(5):dju078. doi: 10.1093/jnci/dju078.
9
Comparison of tomosynthesis plus digital mammography and digital mammography alone for breast cancer screening.数字乳腺断层合成摄影与单纯数字乳腺摄影用于乳腺癌筛查的比较。
Radiology. 2013 Dec;269(3):694-700. doi: 10.1148/radiol.13130307. Epub 2013 Oct 28.
10
Assessing individual breast cancer risk within the U.K. National Health Service Breast Screening Program: a new paradigm for cancer prevention.在英国国家医疗服务体系乳腺癌筛查计划中评估个体乳腺癌风险:癌症预防的新模式。
Cancer Prev Res (Phila). 2012 Jul;5(7):943-51. doi: 10.1158/1940-6207.CAPR-11-0458. Epub 2012 May 11.