Sun Shangpeng, Li Changying, Paterson Andrew H, Jiang Yu, Xu Rui, Robertson Jon S, Snider John L, Chee Peng W
School of Electrical and Computer Engineering, College of Engineering, University of Georgia, Athens, GA, United States.
Department of Crop and Soil Sciences, College of Agricultural and Environmental Sciences, University of Georgia, Athens, GA, United States.
Front Plant Sci. 2018 Jan 22;9:16. doi: 10.3389/fpls.2018.00016. eCollection 2018.
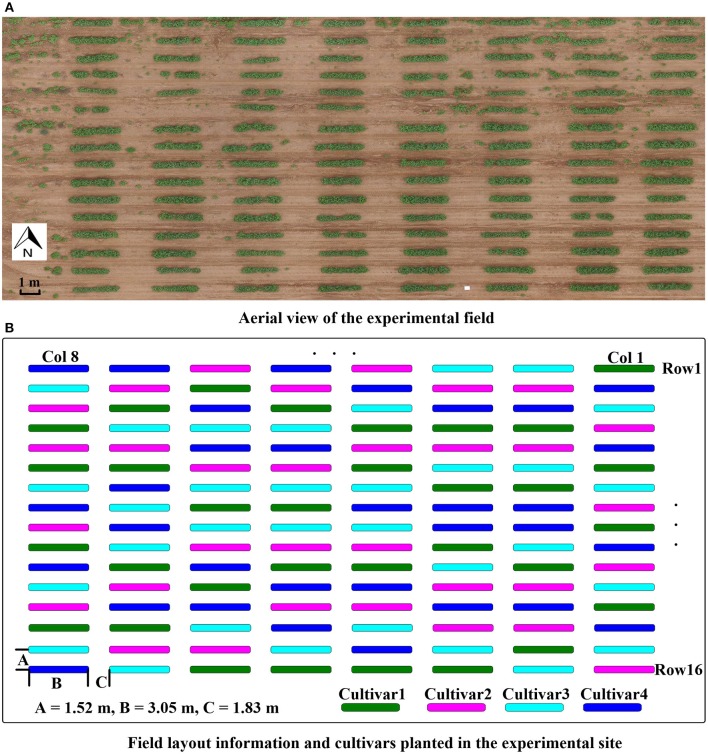
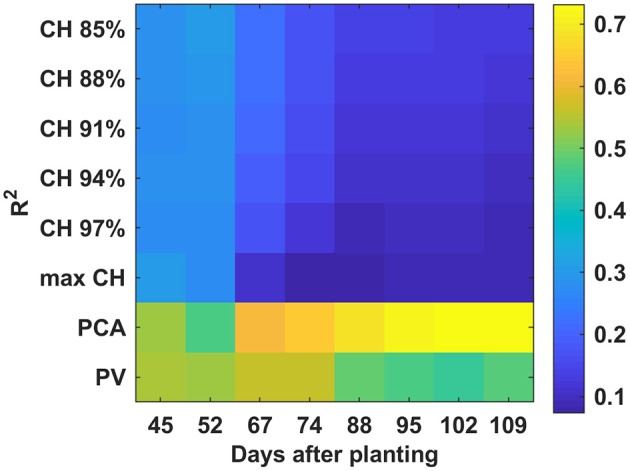
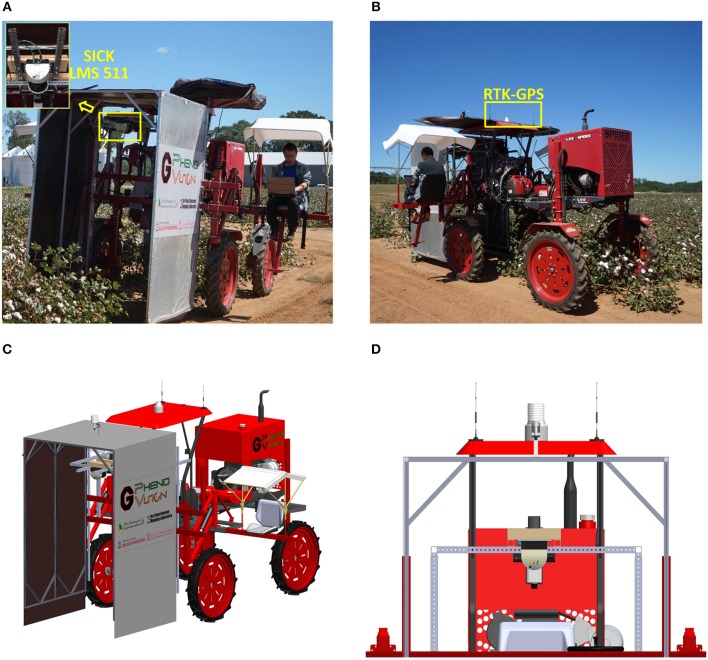
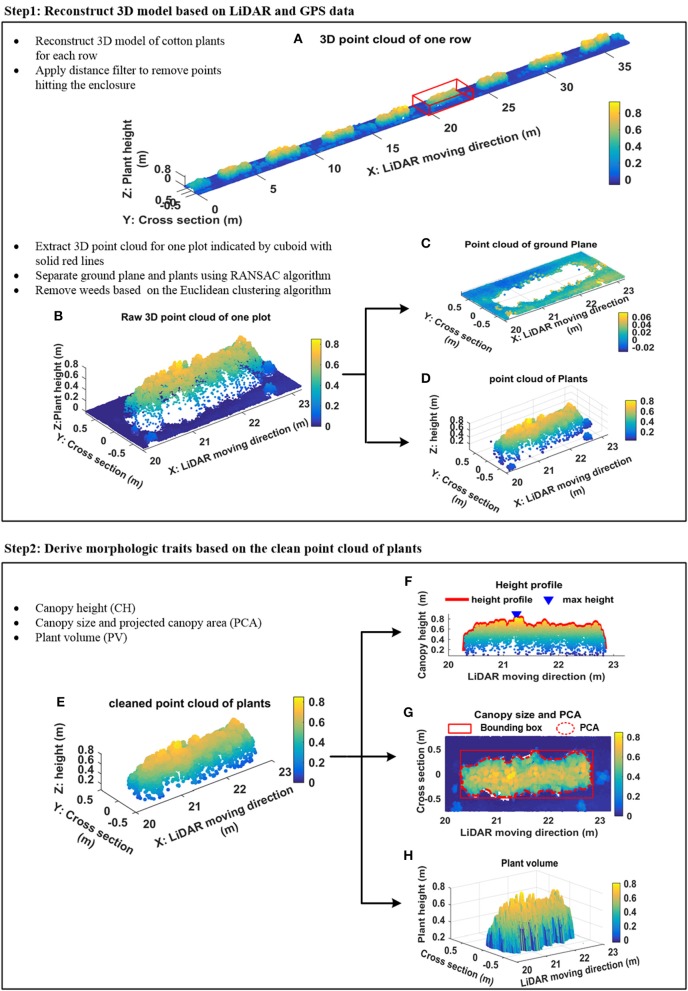
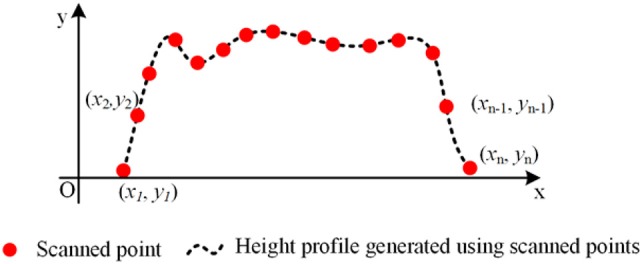
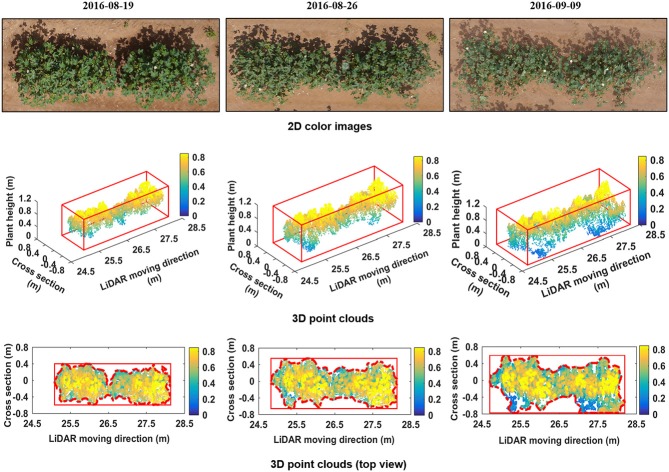
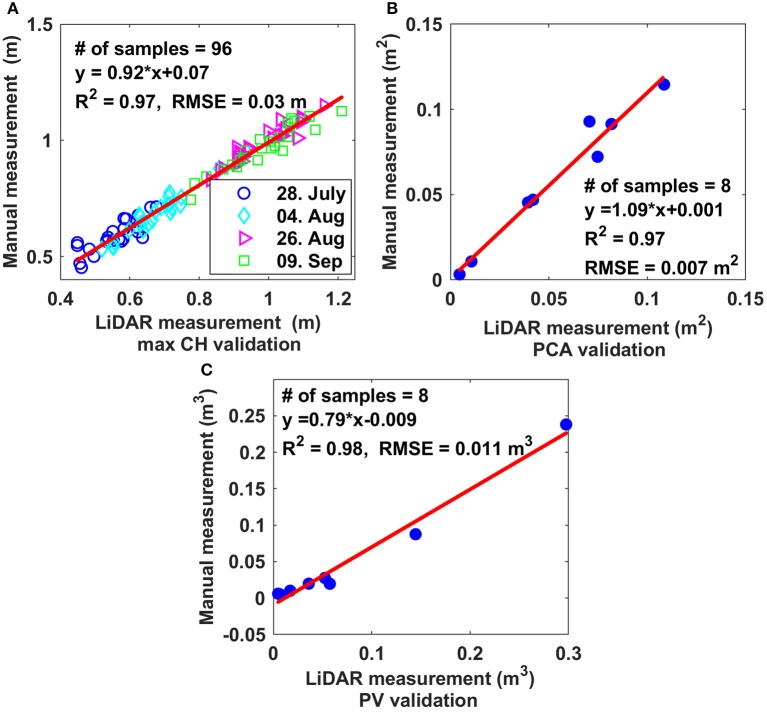
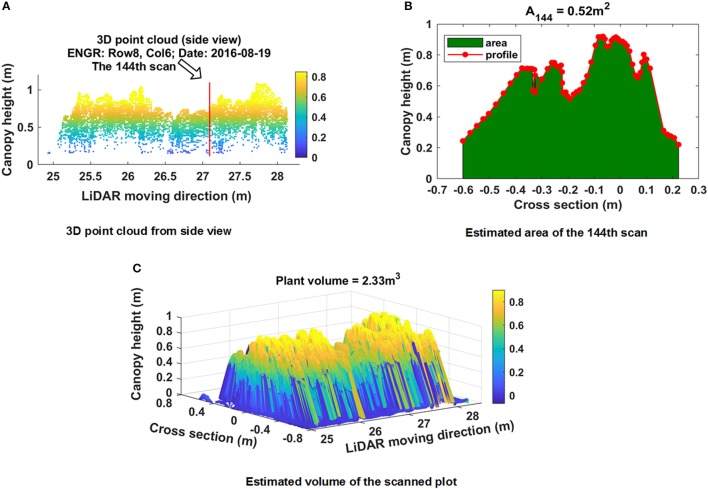
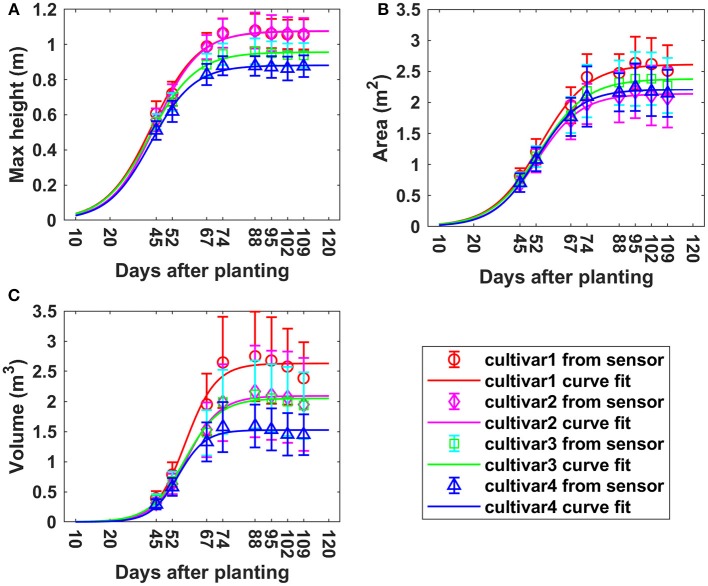
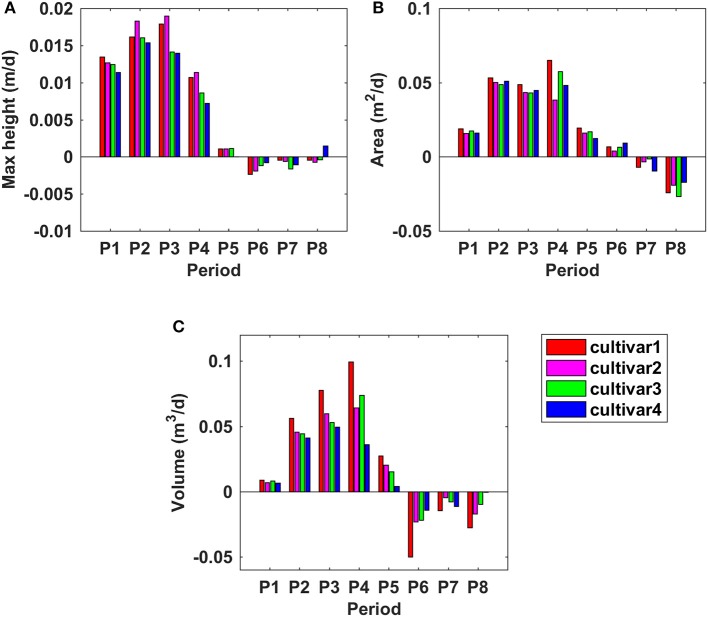
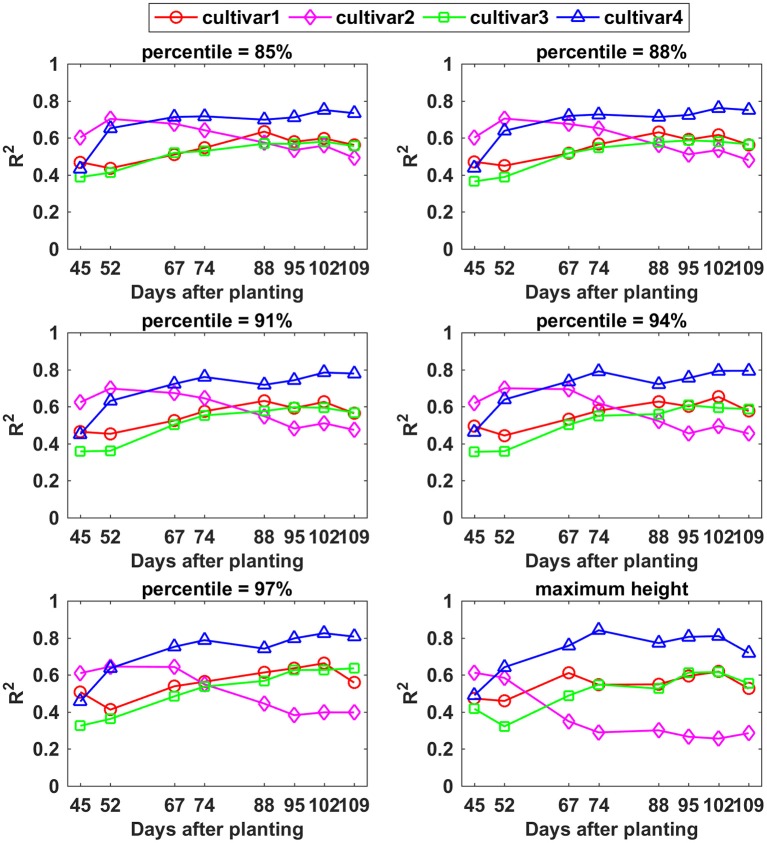
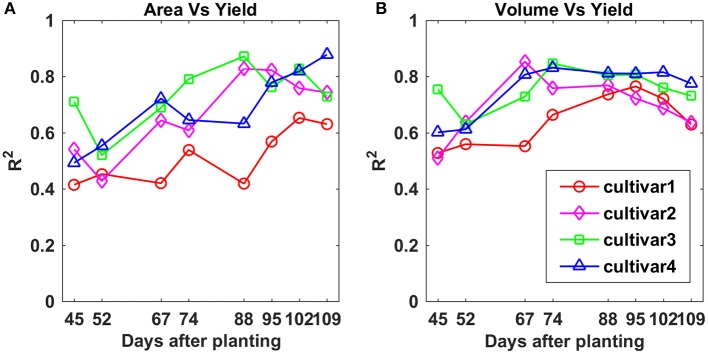
Plant breeding programs and a wide range of plant science applications would greatly benefit from the development of in-field high throughput phenotyping technologies. In this study, a terrestrial LiDAR-based high throughput phenotyping system was developed. A 2D LiDAR was applied to scan plants from overhead in the field, and an RTK-GPS was used to provide spatial coordinates. Precise 3D models of scanned plants were reconstructed based on the LiDAR and RTK-GPS data. The ground plane of the 3D model was separated by RANSAC algorithm and a Euclidean clustering algorithm was applied to remove noise generated by weeds. After that, clean 3D surface models of cotton plants were obtained, from which three plot-level morphologic traits including canopy height, projected canopy area, and plant volume were derived. Canopy height ranging from 85th percentile to the maximum height were computed based on the histogram of the z coordinate for all measured points; projected canopy area was derived by projecting all points on a ground plane; and a Trapezoidal rule based algorithm was proposed to estimate plant volume. Results of validation experiments showed good agreement between LiDAR measurements and manual measurements for maximum canopy height, projected canopy area, and plant volume, with -values of 0.97, 0.97, and 0.98, respectively. The developed system was used to scan the whole field repeatedly over the period from 43 to 109 days after planting. Growth trends and growth rate curves for all three derived morphologic traits were established over the monitoring period for each cultivar. Overall, four different cultivars showed similar growth trends and growth rate patterns. Each cultivar continued to grow until ~88 days after planting, and from then on varied little. However, the actual values were cultivar specific. Correlation analysis between morphologic traits and final yield was conducted over the monitoring period. When considering each cultivar individually, the three traits showed the best correlations with final yield during the period between around 67 and 109 days after planting, with maximum -values of up to 0.84, 0.88, and 0.85, respectively. The developed system demonstrated relatively high throughput data collection and analysis.
植物育种计划和广泛的植物科学应用将从田间高通量表型分析技术的发展中大大受益。在本研究中,开发了一种基于地面激光雷达的高通量表型分析系统。使用二维激光雷达从田间上方扫描植物,并使用实时动态全球定位系统(RTK-GPS)提供空间坐标。基于激光雷达和RTK-GPS数据重建扫描植物的精确三维模型。通过随机抽样一致性(RANSAC)算法分离三维模型的地面平面,并应用欧几里得聚类算法去除杂草产生的噪声。之后,获得了棉花植株的干净三维表面模型,从中导出了三个小区级形态特征,包括冠层高度、投影冠层面积和植株体积。基于所有测量点的z坐标直方图计算第85百分位数到最大高度之间的冠层高度;通过将所有点投影到地面平面上得出投影冠层面积;并提出了一种基于梯形法则的算法来估计植株体积。验证实验结果表明,激光雷达测量值与最大冠层高度、投影冠层面积和植株体积的人工测量值之间具有良好的一致性,相关系数分别为0.97、0.97和0.98。所开发的系统用于在种植后43至109天期间对整个田地进行反复扫描。为每个品种在监测期内建立了所有三个导出形态特征的生长趋势和生长速率曲线。总体而言,四个不同品种呈现出相似的生长趋势和生长速率模式。每个品种在种植后约88天之前持续生长,从那时起变化不大。然而,实际值因品种而异。在监测期内对形态特征与最终产量进行了相关性分析。当单独考虑每个品种时,这三个特征在种植后约67至109天期间与最终产量的相关性最佳,最大相关系数分别高达0.84、0.88和0.85。所开发的系统展示了相对较高的通量数据收集和分析能力。