Yeung Andy W K
Oral and Maxillofacial Radiology, Applied Oral Sciences, Faculty of Dentistry, The University of Hong Kong, Pok Fu Lam, Hong Kong.
Front Hum Neurosci. 2018 Jan 26;12:16. doi: 10.3389/fnhum.2018.00016. eCollection 2018.
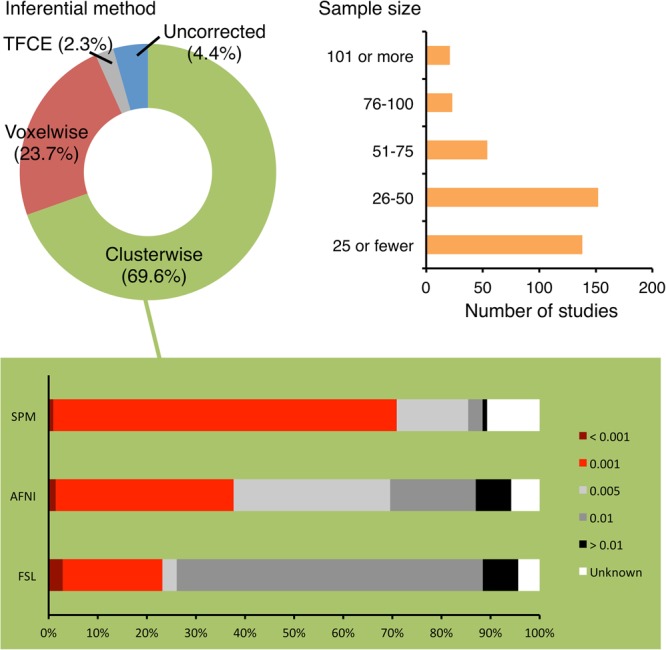
Since the early 2010s, the neuroimaging field has paid more attention to the issue of false positives. Several journals have issued guidelines regarding statistical thresholds. Three papers have reported the statistical analysis of the thresholds used in fMRI literature, but they were published at least 3 years ago and surveyed papers published during 2007-2012. This study revisited this topic to evaluate the changes in this field. The PubMed database was searched to identify the task-based (not resting-state) fMRI papers published in 2017 and record their sample sizes, inferential methods (e.g., voxelwise or clusterwise), theoretical methods (e.g., parametric or non-parametric), significance level, cluster-defining primary threshold (CDT), volume of analysis (whole brain or region of interest) and software used. The majority (95.6%) of the 388 analyzed articles reported statistics corrected for multiple comparisons. A large proportion (69.6%) of the 388 articles reported main results by clusterwise inference. The analyzed articles mostly used software Statistical Parametric Mapping (SPM), Analysis of Functional NeuroImages (AFNI), or FMRIB Software Library (FSL) to conduct statistical analysis. There were 70.9%, 37.6%, and 23.1% of SPM, AFNI, and FSL studies, respectively, that used a CDT of ≤ 0.001. The statistical sample size across the articles ranged between 7 and 1,299 with a median of 33. Sample size did not significantly correlate with the level of statistical threshold. There were still around 53% (142/270) studies using clusterwise inference that chose a more liberal CDT than = 0.001 ( = 121) or did not report their CDT ( = 21), down from around 61% reported by Woo et al. (2014). For FSL studies, it seemed that the CDT practice had no improvement since the survey by Woo et al. (2014). A few studies chose unconventional CDT such as = 0.0125 or 0.004. Such practice might create an impression that the threshold alterations were attempted to show "desired" clusters. The median sample size used in the analyzed articles was similar to those reported in previous surveys. In conclusion, there seemed to be no change in the statistical practice compared to the early 2010s.
自21世纪10年代初以来,神经影像学领域对假阳性问题给予了更多关注。几家期刊发布了有关统计阈值的指南。有三篇论文报告了功能磁共振成像(fMRI)文献中使用的阈值的统计分析,但它们至少在3年前发表,且调查的是2007年至2012年期间发表的论文。本研究重新审视了这个主题,以评估该领域的变化。在PubMed数据库中进行搜索,以识别2017年发表的基于任务(非静息状态)的fMRI论文,并记录它们的样本量、推理方法(例如,体素级或聚类级)、理论方法(例如,参数法或非参数法)、显著性水平、聚类定义初级阈值(CDT)、分析体积(全脑或感兴趣区域)以及使用的软件。在388篇分析文章中,大多数(95.6%)报告了针对多重比较进行校正的统计数据。388篇文章中有很大一部分(69.6%)通过聚类推理报告了主要结果。分析的文章大多使用统计参数映射(SPM)、功能神经影像分析(AFNI)或FMRIB软件库(FSL)软件进行统计分析。分别有70.9%、37.6%和23.1%的SPM、AFNI和FSL研究使用了≤0.001的CDT。文章中的统计样本量在7至1299之间,中位数为33。样本量与统计阈值水平没有显著相关性。仍有大约53%(142/270)使用聚类推理的研究选择了比=0.001更宽松的CDT(=121)或未报告其CDT(=21),低于Woo等人(2014年)报告的约61%。对于FSL研究,自Woo等人(2014年)的调查以来,CDT的做法似乎没有改善。一些研究选择了非常规的CDT,如=0.0125或0.00 &