Department of Radiology, Jagiellonian University Medical College, 19 Kopernika Street, 31-501, Kraków, Poland.
Department of General and Interventional Radiology and Neuroradiology, Wroclaw Medical University, 213 Borowska Street, 50-556, Wrocław, Poland.
Abdom Radiol (NY). 2018 Sep;43(9):2455-2461. doi: 10.1007/s00261-018-1500-9.
The aim of the study was to find which linear measurements, field and volume coefficients correlate the best with real volume of the spleen and can be further used for identification of splenomegaly.
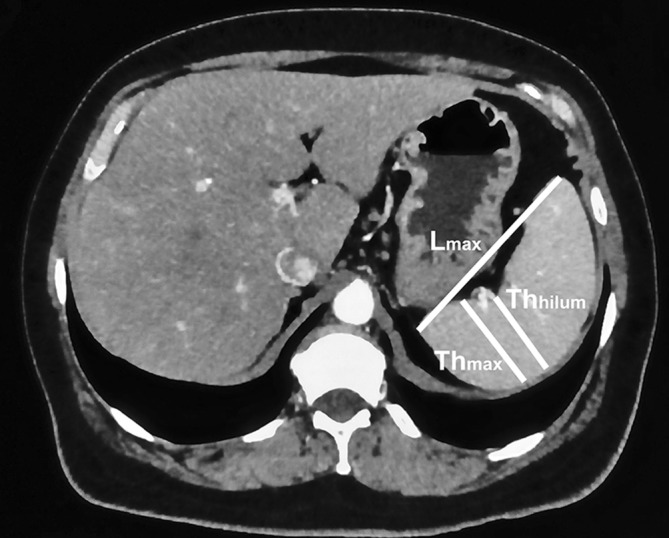
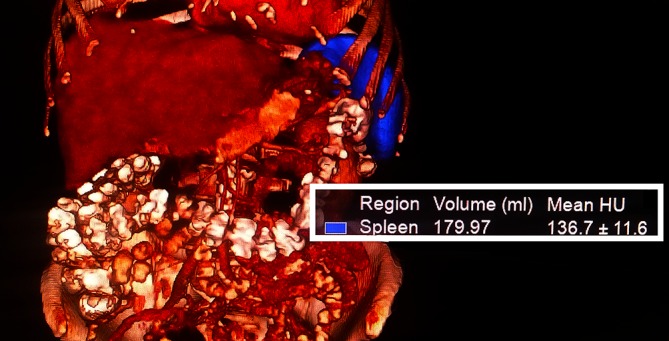
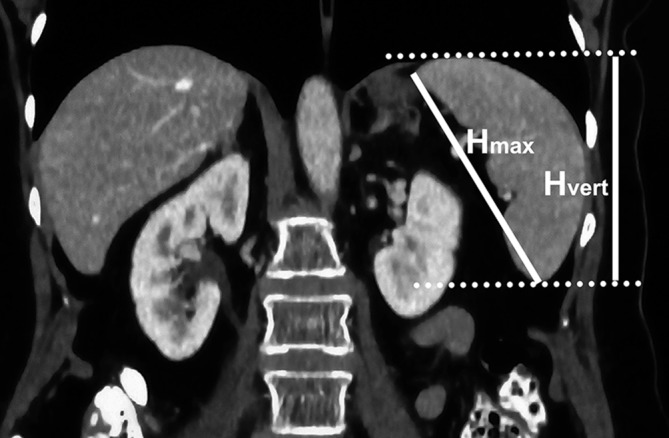
Abdominal computed tomography (CT) examinations of 264 patients were retrospectively analyzed in terms of maximal length, maximal thickness, hilum thickness, maximal height, vertical height and estimated height. Spleen volume was manually measured in Vitrea software. Two- and three-dimensional coefficients were calculated through proper mathematical formulas from linear measurements. Splenomegaly cut-off: 314.5 cm. Data were analyzed with use of Pearson correlation and χ test with statistical significance at p < 0.05.
For single measurements, the correlation with real spleen volume was the strongest for maximal height (r = 0.804; p < 0.05). Among two-dimensional indexes, multiplication product of maximal length and vertical height reached the highest level of correlation with spleen volume (r = 0.923; p < 0.05) and had the highest sensitivity and specificity (94.3% and 93.0%, respectively) for splenomegaly detection (threshold 115 cm). In case of three-dimensional ones, the coefficient calculated from maximal length, vertical height and hilum thickness established the strongest link with spleen volume (r = 0.956; p < 0.05).
Coefficient calculated from maximal length, vertical height and hilum thickness correlates the strongest with spleen volume and can be utilized for monitoring of spleen volume instead of obsolete splenic index. The most suitable for quick splenomegaly screening is two-dimensional coefficient (maximal length × vertical height), with the cut-off 115 cm.
本研究旨在寻找与脾脏实际体积相关性最好的线性测量、面积和体积系数,并进一步用于脾肿大的识别。
回顾性分析 264 例患者的腹部 CT 检查结果,包括最大长度、最大厚度、门脉厚度、最大高度、垂直高度和估计高度。脾脏体积在 Vitrea 软件中手动测量。通过适当的数学公式从线性测量值中计算二维和三维系数。脾肿大截断值:314.5cm。使用 Pearson 相关性分析和 χ 检验分析数据,p 值<0.05 为差异有统计学意义。
对于单个测量值,与实际脾脏体积相关性最强的是最大高度(r=0.804;p<0.05)。在二维指数中,最大长度和垂直高度的乘积与脾脏体积的相关性最高(r=0.923;p<0.05),且对脾肿大的检测具有最高的灵敏度和特异性(分别为 94.3%和 93.0%)(阈值为 115cm)。在三维方面,由最大长度、垂直高度和门脉厚度计算得出的系数与脾脏体积相关性最强(r=0.956;p<0.05)。
由最大长度、垂直高度和门脉厚度计算得出的系数与脾脏体积相关性最强,可以代替过时的脾脏指数来监测脾脏体积。最适合快速筛查脾肿大的是二维系数(最大长度×垂直高度),截断值为 115cm。