Kalinin Alexandr A, Palanimalai Selvam, Dinov Ivo D
University of Michigan.
Proc 2nd Workshop Hum Loop Data Anal (2017). 2017 Apr;2017. doi: 10.1145/3077257.3077262.
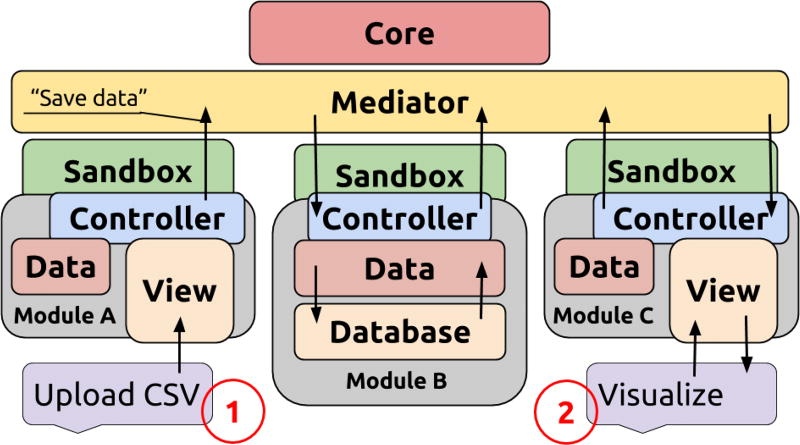
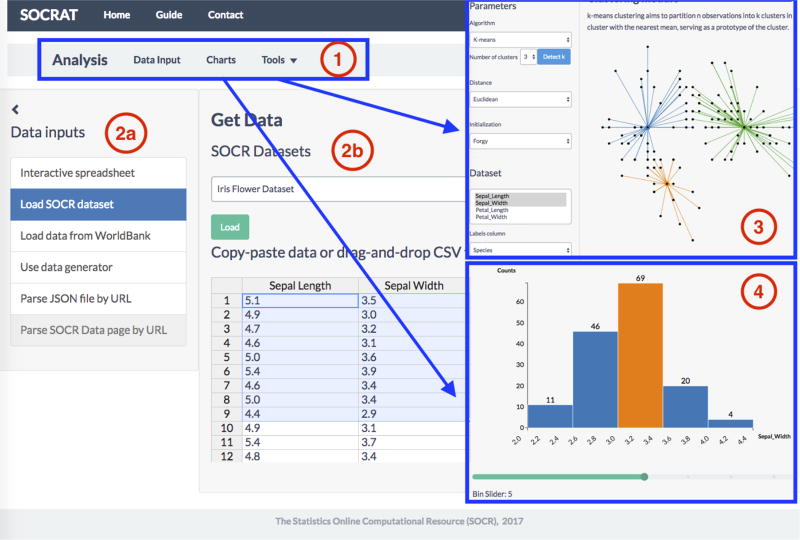
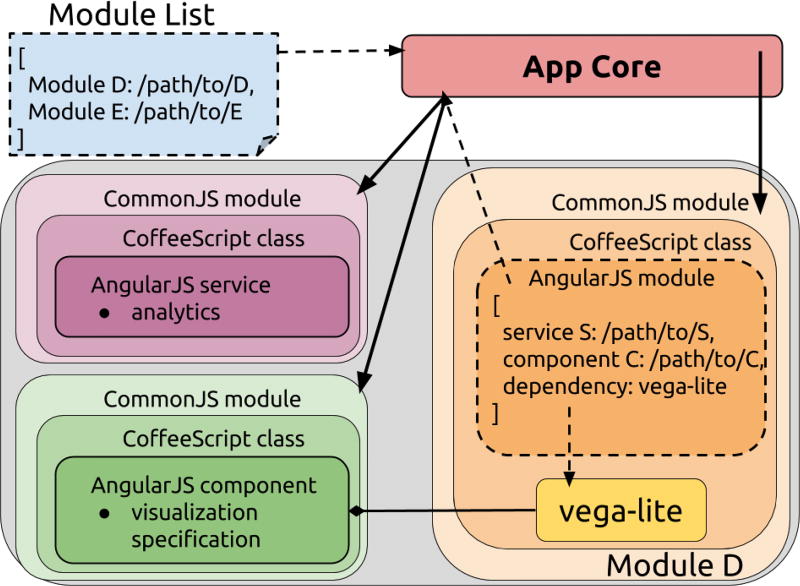
The modern web is a successful platform for large scale interactive web applications, including visualizations. However, there are no established design principles for building complex visual analytics (VA) web applications that could efficiently integrate visualizations with data management, computational transformation, hypothesis testing, and knowledge discovery. This imposes a time-consuming design and development process on many researchers and developers. To address these challenges, we consider the design requirements for the development of a module-based VA system architecture, adopting existing practices of large scale web application development. We present the preliminary design and implementation of an open-source platform for Statistics Online Computational Resource Analytical Toolbox (SOCRAT). This platform defines: (1) a specification for an architecture for building VA applications with multi-level modularity, and (2) methods for optimizing module interaction, re-usage, and extension. To demonstrate how this platform can be used to integrate a number of data management, interactive visualization, and analysis tools, we implement an example application for simple VA tasks including raw data input and representation, interactive visualization and analysis.
现代网络是大规模交互式网络应用程序(包括可视化)的成功平台。然而,对于构建复杂的可视化分析(VA)网络应用程序,目前尚无既定的设计原则,这些应用程序需要有效地将可视化与数据管理、计算转换、假设检验和知识发现相结合。这给许多研究人员和开发人员带来了耗时的设计和开发过程。为应对这些挑战,我们考虑基于现有大规模网络应用程序开发实践,开发基于模块的VA系统架构的设计要求。我们展示了用于统计在线计算资源分析工具箱(SOCRAT)的开源平台的初步设计和实现。该平台定义了:(1)用于构建具有多级模块化的VA应用程序的架构规范,以及(2)用于优化模块交互、重用和扩展的方法。为演示该平台如何用于集成多个数据管理、交互式可视化和分析工具,我们实现了一个用于简单VA任务的示例应用程序,包括原始数据输入和表示、交互式可视化和分析。