Institute of Island and Coastal Ecosystems, Ocean College, Zhejiang University, Zhoushan, 316021, China.
Key Lab of Poyang Lake Wetland and Watershed Research of Ministry of Education, School of Geography and Environment, Jiangxi Normal University, Nanchang, 330022, China.
Int J Health Geogr. 2018 May 25;17(1):15. doi: 10.1186/s12942-018-0135-y.
The increase in the frequency and intensity of extreme heat events, which are potentially associated with climate change in the near future, highlights the importance of heat health risk assessment, a significant reference for heat-related death reduction and intervention. However, a spatiotemporal mismatch exists between gridded heat hazard and human exposure in risk assessment, which hinders the identification of high-risk areas at finer scales.
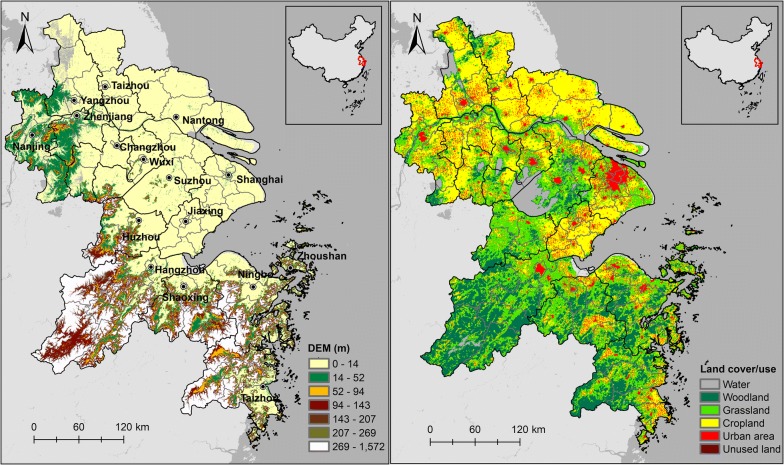
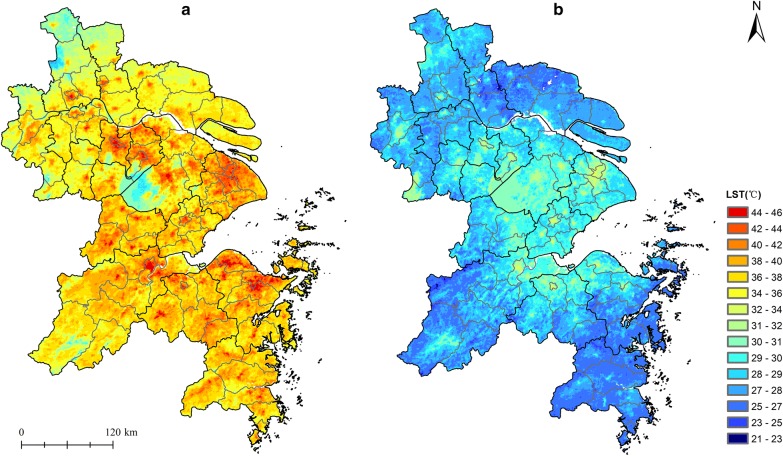
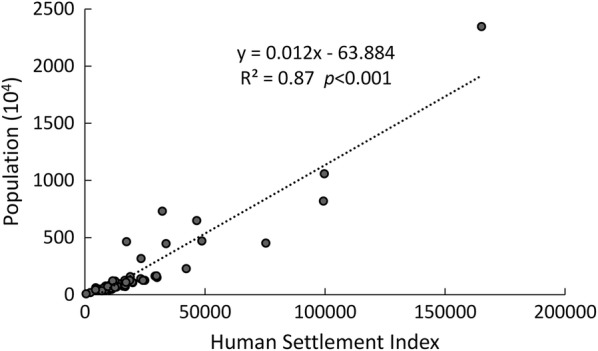
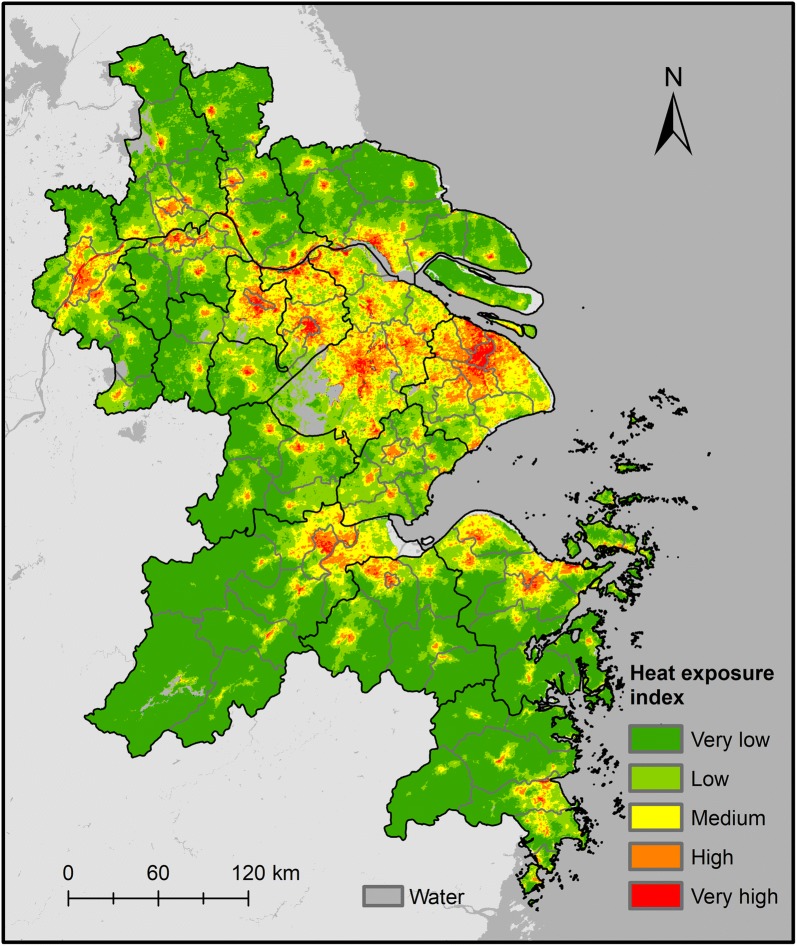
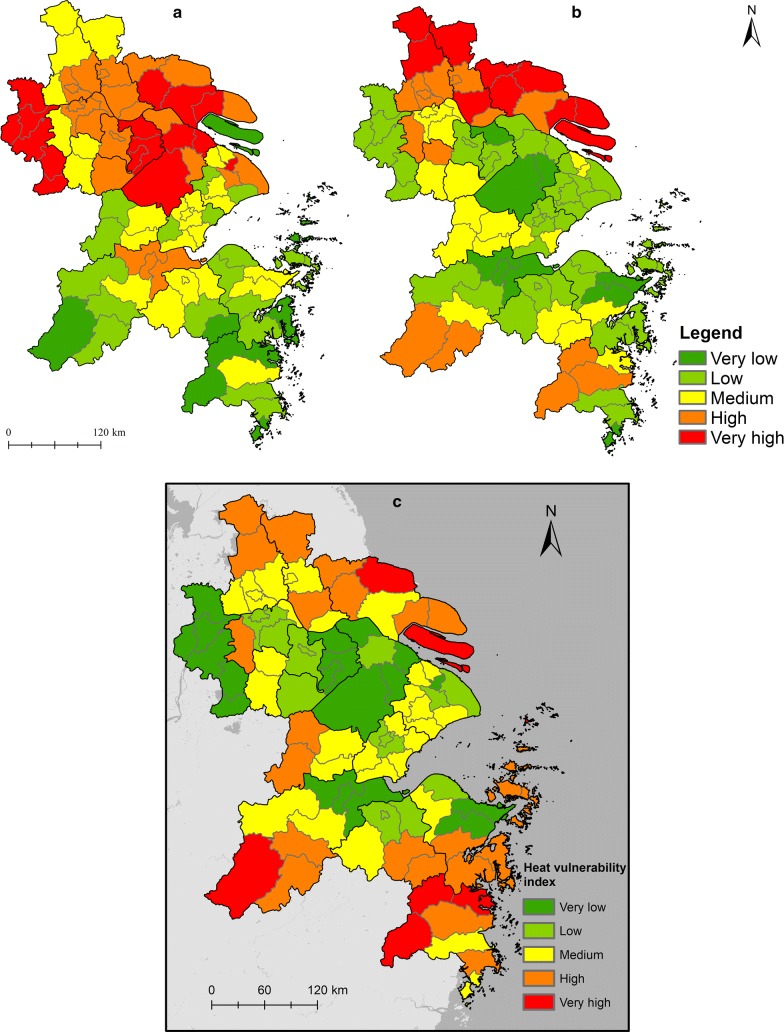
A human settlement index integrated by nighttime light images, enhanced vegetation index, and digital elevation model data was utilized to assess the human exposure at high spatial resolution. Heat hazard and vulnerability index were generated by land surface temperature and demographic and socioeconomic census data, respectively. Spatially explicit assessment of heat health risk and its driving factors was conducted in the Yangtze River Delta (YRD), east China at 250 m pixel level.
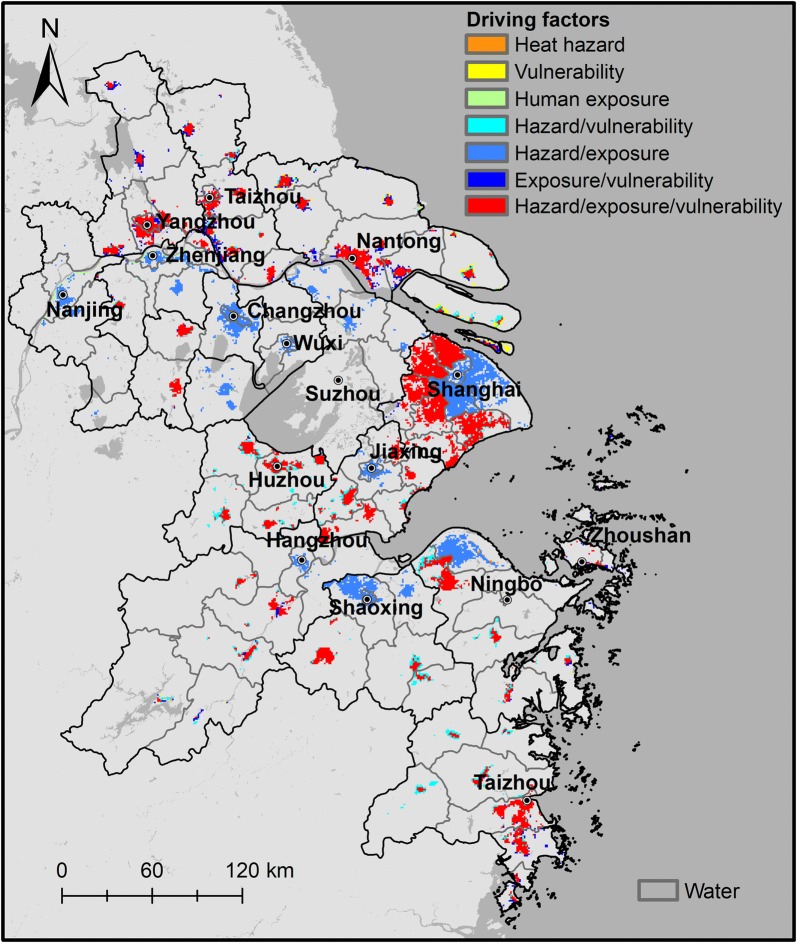
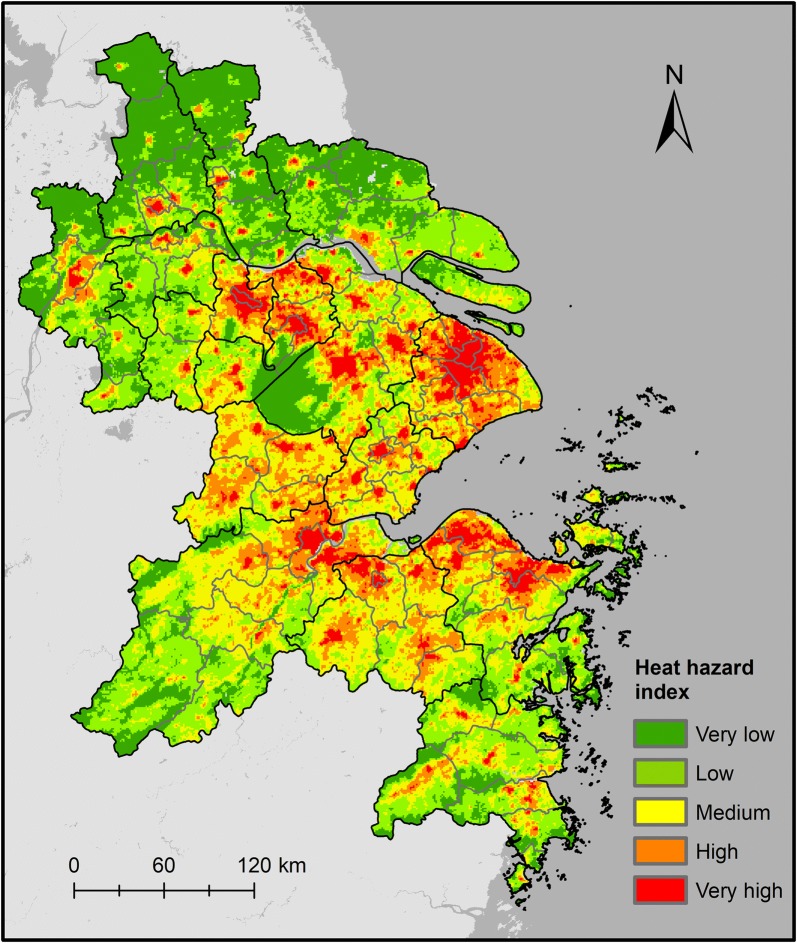
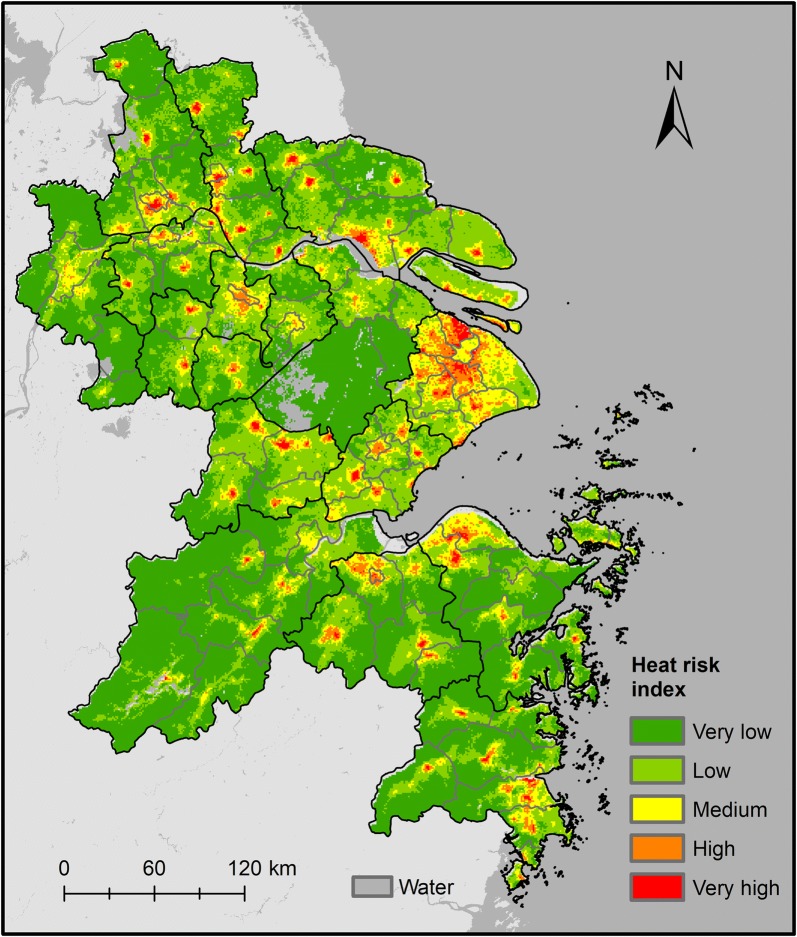
High-risk areas were mainly distributed in the urbanized areas of YRD, which were mostly driven by high human exposure and heat hazard index. In some less-urbanized cities and suburban and rural areas of mega-cities, the heat health risks are in second priority. The risks in some less-developed areas were high despite the low human exposure index because of high heat hazard and vulnerability index.
This study illustrated a methodology for identifying high-risk areas by combining freely available multi-source data. Highly urbanized areas were considered hotspots of high heat health risks, which were largely driven by the increasing urban heat island effects and population density in urban areas. Repercussions of overheating were weakened due to the low social vulnerability in some central areas benefitting from the low proportion of sensitive population or the high level of socioeconomic development. By contrast, high social vulnerability intensifies heat health risks in some less-urbanized cities and suburban areas of mega-cities.
未来,极端高温事件的频率和强度可能会增加,这与气候变化有关,因此强调了进行热健康风险评估的重要性,这是减少与热相关的死亡和干预的重要参考。然而,在风险评估中,网格热危害与人类暴露之间存在时空不匹配,这阻碍了在更精细的尺度上识别高风险区域。
利用夜间灯光图像、增强植被指数和数字高程模型数据综合生成的人类住区指数,来评估高空间分辨率的人类暴露情况。利用土地表面温度和人口及社会经济普查数据分别生成热危害和脆弱性指数。在 250 米像素水平上,对中国东部长江三角洲(YRD)进行了热健康风险及其驱动因素的空间明确评估。
高风险区域主要分布在 YRD 的城市化地区,这些地区主要受到高人类暴露和热危害指数的驱动。在一些城市化程度较低的城市以及特大城市的郊区和农村地区,热健康风险处于次要优先级。尽管人类暴露指数较低,但由于高热危害和脆弱性指数,一些欠发达地区的风险仍然很高。
本研究通过结合免费的多源数据说明了一种识别高风险区域的方法。高度城市化地区被认为是高热健康风险的热点区域,这主要是由于城市热岛效应的增强和城市地区人口密度的增加。由于一些中心区域的社会脆弱性较低,受益于敏感人口比例较低或社会经济发展水平较高,过热的影响减弱。相比之下,一些欠发达城市和特大城市郊区的高社会脆弱性加剧了热健康风险。