Department of Family and Community Medicine, Imam Abdulrahman Bin Faisal University, Dammam, Saudi Arabia.
Division of Epidemiology and Biostatistics, University of Leeds, Leeds, UK.
BMC Public Health. 2018 Jun 26;18(1):791. doi: 10.1186/s12889-018-5723-z.
Health and socioeconomic status (SES) are linked in studies worldwide. Measures of SES exist for many countries, however not for Saudi Arabia (SA). We describe two indices of area-based SES for SA.
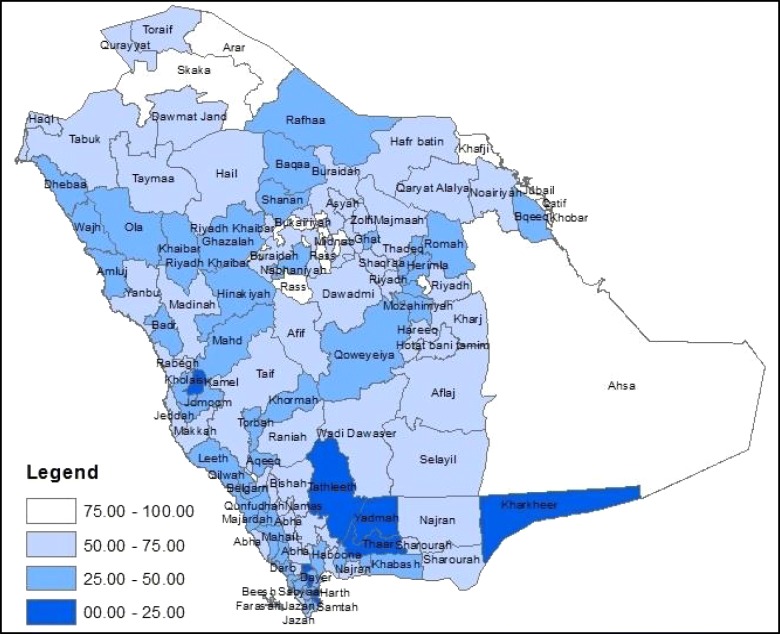
Routine census data has been used to construct two indices of SES at the geographically-delimited administrative region of Governorates in SA (n = 118). The data used included indicators of educational status, employment status, car and material ownership. A continuous measure of SES was constructed using exploratory factor analysis (EFA) and a categorical measure of SES using latent class analysis (LCA). Both indices were mapped by Governorates.
The EFA identified three factors: The first explained 51.58% of the common variance within the interrelated factors, the second 15.14%, and the third 14.26%. These proportions were used in the formulation of the standard index. The scores were fixed to range from 100 for the affluent Governorate and 0 for the deprived. The LCA found a 4 class model as the best model fit. Class 1 was termed "affluent" and included 11.01% of Governorates, class 2 "upper middle class" (44.91%), class 3 "lower middle class" (33.05%) and class 4 "deprived" (11.01%). The populated urbanised Governorates were found to be the most affluent whereas the smaller rural Governorates were the most deprived.
This is the first description of measures of SES in SA at a geographical level. Two measures have been successfully constructed and mapped. The maps show similar patterns suggesting validity. Both indices support the common perception of SES in SA.
健康和社会经济地位(SES)在世界范围内的研究中是相关的。许多国家都有 SES 的衡量标准,但沙特阿拉伯(SA)没有。我们描述了两种基于地区的 SA SES 指标。
常规人口普查数据已被用于构建 SA 地理限定的行政区域(省)的两种 SES 指数(n=118)。使用的数据包括教育状况、就业状况、汽车和物质拥有情况的指标。使用探索性因素分析(EFA)构建 SES 的连续衡量标准,并使用潜在类别分析(LCA)构建 SES 的分类衡量标准。两个指数都按省进行了映射。
EFA 确定了三个因素:第一个因素解释了相互关联因素内共同方差的 51.58%,第二个因素解释了 15.14%,第三个因素解释了 14.26%。这些比例用于制定标准指数。分数的范围固定为富裕省为 100,贫困省为 0。LCA 发现 4 类模型是最佳模型拟合。第 1 类称为“富裕”,包括 11.01%的省,第 2 类为“中上阶层”(44.91%),第 3 类为“中下阶层”(33.05%),第 4 类为“贫困”(11.01%)。人口稠密的城市化省被认为是最富裕的,而较小的农村省则是最贫困的。
这是首次在地理层面上描述 SA 的 SES 衡量标准。已经成功构建和映射了两种措施。这些地图显示出相似的模式,表明其有效性。这两个指数都支持对 SA SES 的普遍看法。