Institute of Health and Society, Newcastle University, Newcastle upon Tyne, NE2 4AX, UK.
BMC Med. 2018 Sep 21;16(1):171. doi: 10.1186/s12916-018-1148-x.
Timely recognition of the end of life allows patients to discuss preferences and make advance plans, and clinicians to introduce appropriate care. We examined changes in frailty over 1 year, with the aim of identifying trajectories that could indicate where an individual is at increased risk of all-cause mortality and may require palliative care.
Electronic health records from 13,149 adults (cases) age 75 and over who died during a 1-year period (1 January 2015 to 1 January 2016) were age, sex and general practice matched to 13,149 individuals with no record of death over the same period (controls). Monthly frailty scores were obtained for 1 year prior to death for cases, and from 1 January 2015 to 1 January 2016 for controls using the electronic frailty index (eFI; a cumulative deficit measure of frailty, available in most English primary care electronic health records, and ranging in value from 0 to 1). Latent growth mixture models were used to investigate longitudinal patterns of change and associated impact on mortality. Cases were reweighted to the population level for tests of diagnostic accuracy.
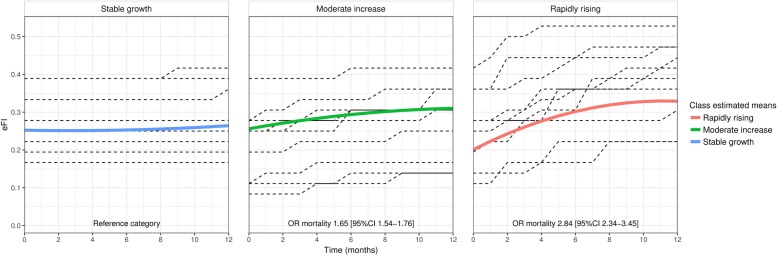
Three distinct frailty trajectories were identified. Rapidly rising frailty (initial increase of 0.022 eFI per month before slowing from a baseline eFI of 0.21) was associated with a 180% increase in mortality (OR 2.84, 95% CI 2.34-3.45) for 2.2% of the sample. Moderately increasing frailty (eFI increase of 0.007 per month, with baseline of 0.26) was associated with a 65% increase in mortality (OR 1.65, 95% CI 1.54-1.76) for 21.2% of the sample. The largest (76.6%) class was stable frailty (eFI increase of 0.001 from a baseline of 0.26). When cases were reweighted to population level, rapidly rising frailty had 99.1% specificity and 3.2% sensitivity (positive predictive value 19.8%, negative predictive value 93.3%) for predicting individual risk of mortality.
People aged over 75 with frailty who are at highest risk of death have a distinctive frailty trajectory in the last 12 months of life, with a rapid initial rise from a low baseline, followed by a plateau. Routine measurement of frailty can be useful to support clinicians to identify people with frailty who are potential candidates for palliative care, and allow time for intervention.
及时识别生命末期可以让患者讨论偏好并制定预先计划,让临床医生提供适当的护理。我们研究了 1 年内衰弱的变化,目的是确定可能表明个体处于全因死亡率增加风险并可能需要姑息治疗的轨迹。
从 2015 年 1 月 1 日至 2016 年 1 月 1 日期间死亡的 13149 名 75 岁及以上成年人(病例)的电子健康记录,按年龄、性别和全科医生进行匹配,与同期无死亡记录的 13149 名个体(对照组)相匹配。使用电子衰弱指数(eFI;一种常见的衰弱累积衡量标准,可在大多数英国初级保健电子健康记录中获得,取值范围为 0 到 1),为病例获得死亡前 1 年的每月衰弱评分,为对照组获得 2015 年 1 月 1 日至 2016 年 1 月 1 日的每月衰弱评分。使用潜在增长混合模型研究变化的纵向模式及其对死亡率的影响。为了测试诊断准确性,对病例进行了重新加权,以反映人口水平。
确定了三种不同的衰弱轨迹。快速上升的衰弱(初始每月增加 0.022 eFI,从基线 eFI 0.21 开始减慢)与死亡率增加 180%相关(OR 2.84,95%CI 2.34-3.45),占样本的 2.2%。中度增加的衰弱(每月增加 0.007 eFI,基线为 0.26)与死亡率增加 65%相关(OR 1.65,95%CI 1.54-1.76),占样本的 21.2%。最大的(76.6%)类别是稳定的衰弱(从基线 0.26 增加 0.001 eFI)。当病例被重新加权到人口水平时,快速上升的衰弱对预测个体死亡风险具有 99.1%的特异性和 3.2%的敏感性(阳性预测值 19.8%,阴性预测值 93.3%)。
75 岁以上有衰弱症状且死亡风险最高的人,在生命的最后 12 个月有一个独特的衰弱轨迹,从低基线开始迅速上升,然后达到一个平台期。常规衰弱测量可以帮助临床医生识别衰弱的人,他们可能是姑息治疗的潜在候选人,并为干预留出时间。