Department of Mathematics and Statistics, Lancaster University, Lancaster, UK.
Institute of Medical Biometry and Informatics, University of Heidelberg, Heidelberg, Germany.
Stat Med. 2018 Dec 30;37(30):4636-4651. doi: 10.1002/sim.7940. Epub 2018 Sep 9.
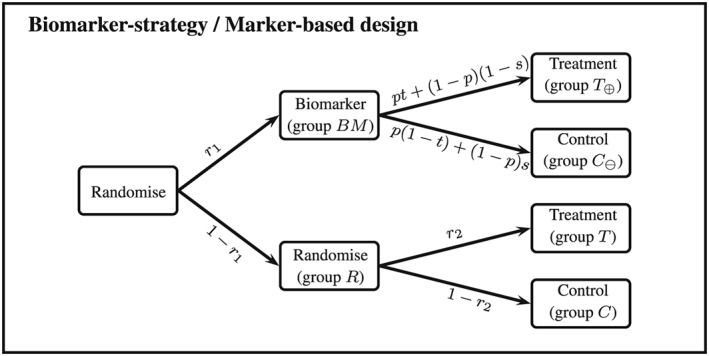
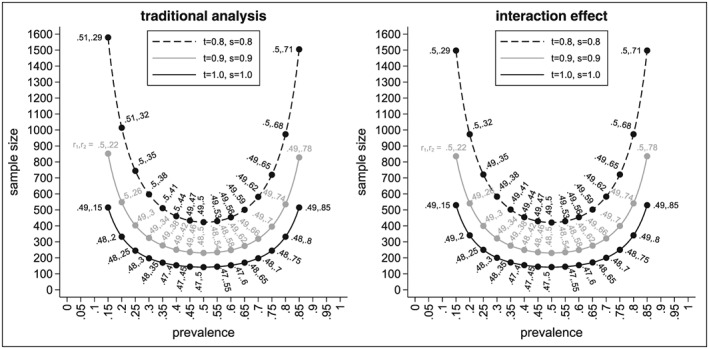
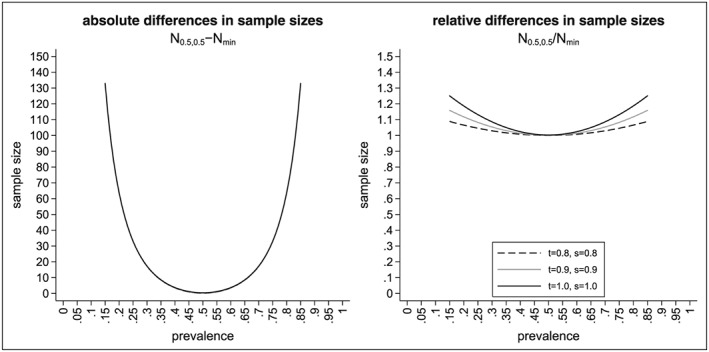
Recent developments in genomics and proteomics enable the discovery of biomarkers that allow identification of subgroups of patients responding well to a treatment. One currently used clinical trial design incorporating a predictive biomarker is the so-called biomarker strategy design (or marker-based strategy design). Conventionally, the results from this design are analysed by comparing the mean of the biomarker-led arm with the mean of the randomised arm. Several problems regarding the analysis of the data obtained from this design have been identified in the literature. In this paper, we show how these problems can be resolved if the sample sizes in the subgroups fulfil the specified orthogonality condition. We also propose a different analysis strategy that allows definition of test statistics for the biomarker-by-treatment interaction effect as well as for the classical treatment effect and the biomarker effect. We derive equations for the sample size calculation for the case of perfect and imperfect biomarker assays. We also show that the often used 1:1 randomisation does not necessarily lead to the smallest sample size. In addition, we provide point estimators and confidence intervals for the treatment effects in the subgroups. Application of our method is illustrated using a real data example.
基因组学和蛋白质组学的最新发展使发现生物标志物成为可能,这些标志物可识别对治疗反应良好的患者亚组。目前正在使用的一种包含预测生物标志物的临床试验设计是所谓的生物标志物策略设计(或基于标志物的策略设计)。传统上,通过比较生物标志物引导臂的平均值与随机臂的平均值来分析这种设计的结果。文献中已经确定了从这种设计中获得的数据的分析存在几个问题。在本文中,如果亚组中的样本量满足指定的正交条件,我们将展示如何解决这些问题。我们还提出了一种不同的分析策略,允许定义生物标志物-治疗相互作用效应以及经典治疗效应和生物标志物效应的检验统计量。我们为完美和不完美的生物标志物检测的情况推导出了样本量计算公式。我们还表明,常用的 1:1 随机化不一定会导致最小的样本量。此外,我们还提供了亚组中治疗效果的点估计值和置信区间。我们使用实际数据示例说明了我们方法的应用。